01. Jupyter & Google Colab で始める Drawlib
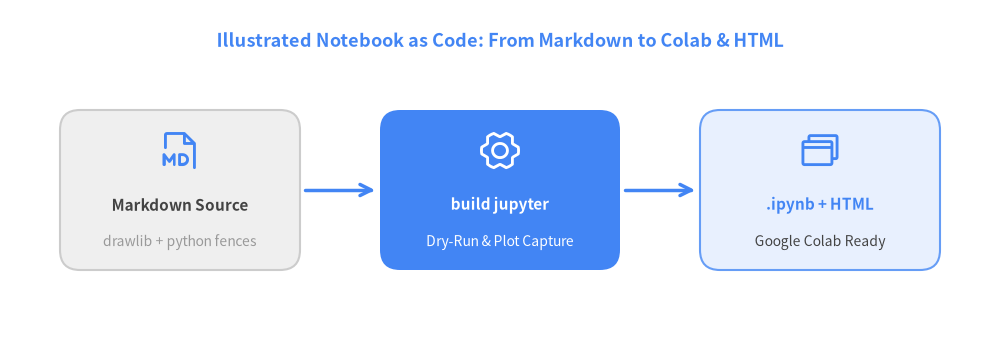
インタラクティブな Drawlib ハンズオンノートブック シリーズへようこそ!Drawlib の type = "jupyter" プロジェクトは、解説テキスト(Markdown)・構成図(drawlib ブロック)・実行可能な Python セルを単一の Markdown ソースとして統合管理します。
View Drawlib Python Code
from drawlib.canvas import save, setup
from drawlib.icons import phosphor
from drawlib.lines import line
from drawlib.shapes import rectangle
from drawlib.styles import Styles
from drawlib.text import text

setup(width=100, height=34)

text(
    (50, 30),
    "Illustrated Notebook as Code: From Markdown to Colab & HTML",
    style=Styles.PrimaryBold.patch(text_size=13),
)

# Stage 1: Markdown Source
rectangle((18, 15), width=24, height=16, style=Styles.Neutral.patch(shape_r=2.0))
phosphor.file_md((18, 19), width=4.5, style=Styles.Primary)
text((18, 13.5), "Markdown Source", style=Styles.DarkBold.patch(text_size=11))
text((18, 9.8), "drawlib + python fences", style=Styles.Muted.patch(text_size=10))

# Stage 2: Drawlib Builder + Dry-Run
rectangle((50, 15), width=24, height=16, style=Styles.PrimaryFlat.patch(shape_r=2.0))
phosphor.gear_six((50, 19), width=4.5, style=Styles.White)
text((50, 13.5), "build jupyter", style=Styles.WhiteBold.patch(text_size=11))
text((50, 9.8), "Dry-Run & Plot Capture", style=Styles.White.patch(text_size=10))

# Stage 3: Dual Output
rectangle((82, 15), width=24, height=16, style=Styles.PrimaryNeutral.patch(shape_r=2.0))
phosphor.browsers((82, 19), width=4.5, style=Styles.Primary)
text((82, 13.5), ".ipynb + HTML", style=Styles.PrimaryBold.patch(text_size=11))
text((82, 9.8), "Google Colab Ready", style=Styles.Dark.patch(text_size=10))

line((30.5, 15), (37.5, 15), arrow_head="->", style=Styles.PrimaryBold)
line((62.5, 15), (69.5, 15), arrow_head="->", style=Styles.PrimaryBold)

save()
1. setup(..., cwd=True) による決定的なパス解決
通常の .py スクリプトでは、Drawlib はスクリプトファイルが存在するディレクトリを基準に相対パス(save()、image()、Dimage() など)を解決します。一方、JupyterLab や Google Colab、あるいはインプロセスのドライラン実行では物理的な .py ファイルが存在しないため、setup(..., cwd=True) を明示的に指定することでカレントワーキングディレクトリ(os.getcwd())を基準に決定的なパス解決を行います。
In [setup]:
!pip install -q drawlib
In [1]:
import os
from drawlib.canvas import clear, setup

setup(width=100, height=30, cwd=True)
print(f"Canvas initialized in working directory: {os.path.basename(os.getcwd())}")
clear()
Out [1]:
Canvas initialized in working directory: jupyter
2. show() によるインライン図解レンダリング
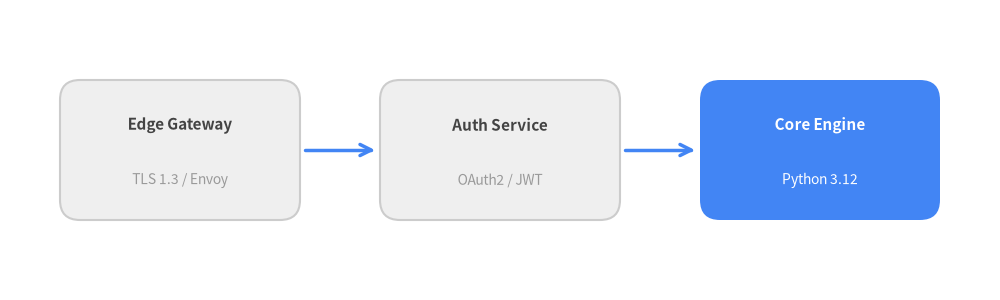
ノートブック内では、前のセルで定義した変数が後続のセルへそのまま引き継がれます。Python セルでサービス一覧を定義し、次のセルで図解としてインライン描画してみましょう。
In [2]:
services = [
    ("Edge Gateway", "TLS 1.3 / Envoy", 18.0),
    ("Auth Service", "OAuth2 / JWT", 50.0),
    ("Core Engine", "Python 3.12", 82.0),
]
print(f"Loaded {len(services)} architecture nodes for inline rendering.")
services[-1]
Out [2]:
Loaded 3 architecture nodes for inline rendering.
('Core Engine', 'Python 3.12', 82.0)
定義した services 変数を Drawlib キャンバス上に描画します。
In [3]:
from drawlib.canvas import show, setup
from drawlib.lines import line
from drawlib.shapes import rectangle
from drawlib.styles import Styles
from drawlib.text import text

setup(width=100, height=30, cwd=True)

for idx, (name, stack, cx) in enumerate(services):
    box_style = Styles.PrimaryFlat if idx == 2 else Styles.Neutral
    title_style = Styles.WhiteBold if idx == 2 else Styles.DarkBold
    sub_style = Styles.White if idx == 2 else Styles.Muted

    rectangle((cx, 15), width=24, height=14, style=box_style.patch(shape_r=2.0))
    text((cx, 17.5), name, style=title_style.patch(text_size=11))
    text((cx, 12.0), stack, style=sub_style.patch(text_size=10))

line((30.5, 15), (37.5, 15), arrow_head="->", style=Styles.PrimaryBold)
line((62.5, 15), (69.5, 15), arrow_head="->", style=Styles.PrimaryBold)

show()
Out [3]: