06. 自動グラフレイアウトソルバー(get_layout())
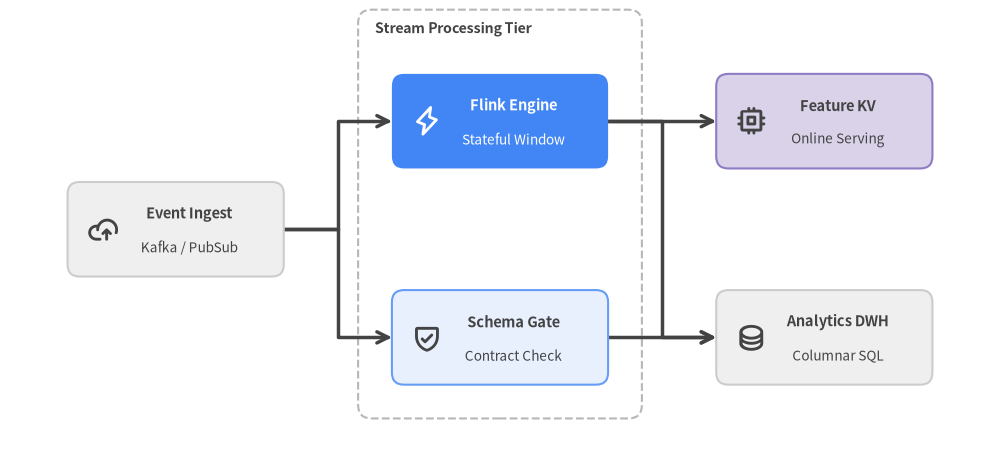
ノード数が増えると手動での (x, y) 座標調整は煩雑になります。drawlib.graph は 5 種類の決定的座標ソルバー(ArchitectureGraph、LayerGraph、TreeGraph、RadialGraph、GridGraph)を提供し、.xy(中心座標)、.bottom_left(左下座標)、および直交ルーティング済みの edge.points を自動算出します。
View Drawlib Python Code
from drawlib.canvas import save, setup
from drawlib.graph import LayerGraph
from drawlib.icons import phosphor
from drawlib.lines import lines
from drawlib.shapes import rectangle
from drawlib.styles import Styles
from drawlib.text import text

setup(width=148, height=68)

g = LayerGraph(direction="LR", default_node_width=32.0, default_node_height=14.0)
g.node("ingest", layer=0)
g.tier("processing", ["stream", "validate"], layer=1)
g.cluster("etl_cluster", ["stream", "validate"], padding=5.0, header_height=4.5)
g.tier("serving", ["feature", "warehouse"], layer=2)

g.edge("ingest", "stream")
g.edge("ingest", "validate")
g.edge("stream", "feature")
g.edge("stream", "warehouse")
g.edge("validate", "warehouse")

layout = g.get_layout(margin=11.0)

stage = layout["etl_cluster"]
rectangle(stage.xy, width=stage.width, height=stage.height, style=Styles.MutedDashed.patch(shape_r=2.0))
text(
    (stage.left + 2.5, stage.top - 2.8),
    "Stream Processing Tier",
    style=Styles.DarkBold.patch(halign="left", text_size=10.2),
)

for edge in layout.edges:
    lines(edge.points, arrow_head="->", style=Styles.DarkBold)

cards = [
    ("ingest", "Event Ingest", "Kafka / PubSub", Styles.Neutral, Styles.DarkBold, Styles.Dark, phosphor.cloud_arrow_up),
    ("stream", "Flink Engine", "Stateful Window", Styles.PrimaryFlat, Styles.WhiteBold, Styles.White, phosphor.lightning),
    ("validate", "Schema Gate", "Contract Check", Styles.PrimaryNeutral, Styles.DarkBold, Styles.Dark, phosphor.shield_check),
    ("feature", "Feature KV", "Online Serving", Styles.SecondaryNeutral, Styles.DarkBold, Styles.Dark, phosphor.cpu),
    ("warehouse", "Analytics DWH", "Columnar SQL", Styles.Neutral, Styles.DarkBold, Styles.Dark, phosphor.database),
]

for nid, title, sub, card_st, title_st, sub_st, icon_fn in cards:
    n = layout[nid]
    rectangle(n.xy, width=n.width, height=n.height, style=card_st.patch(shape_r=1.8))
    icon_fn((n.x - 10.8, n.y), width=4.5, style=title_st)
    text((n.x + 2.0, n.y + 2.3), title, style=title_st.patch(text_size=10.5))
    text((n.x + 2.0, n.y - 2.7), sub, style=sub_st.patch(text_size=9.8))

save()
1. Python セルで自動算出された座標を確認する
ノートブック上では、1 つ目のセルでグラフトポロジを定義して座標を計算し、次のセルでその結果を描画できます。
In [setup]:
!pip install -q drawlib
In [1]:
from drawlib.graph import TreeGraph

tree = TreeGraph(direction="TB", root="platform", default_node_width=28.0, default_node_height=11.0)
tree.child("platform", "compute")
tree.child("platform", "storage")
tree.child("platform", "network")

tree_layout = tree.get_layout(width=116.0, height=46.0, margin=6.0)
for node_id in ("platform", "compute", "storage", "network"):
    node = tree_layout[node_id]
    print(f"{node_id:10s} -> center={node.xy}, bottom_left={node.bottom_left}")
Out [1]:
platform   -> center=(58.0, 34.5), bottom_left=(44.0, 29.0)
compute    -> center=(20.0, 11.5), bottom_left=(6.0, 6.0)
storage    -> center=(58.0, 11.5), bottom_left=(44.0, 6.0)
network    -> center=(96.0, 11.5), bottom_left=(82.0, 6.0)
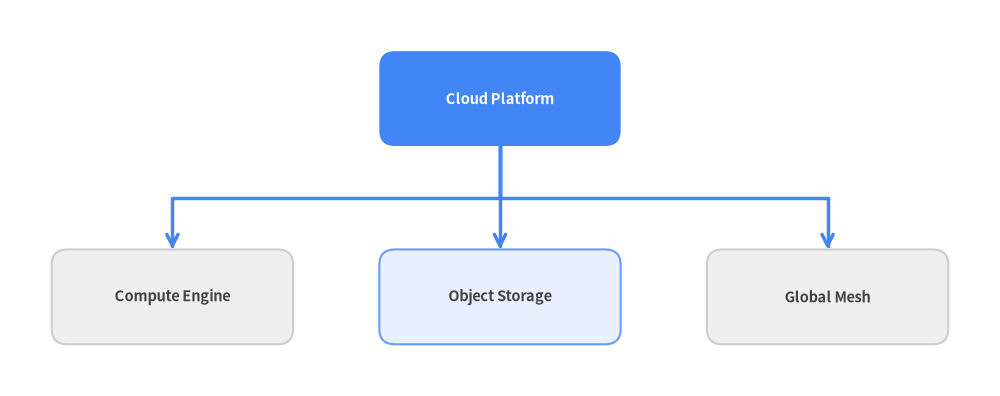
2. 算出された TreeGraph レイアウトの描画
前のセルで計算した tree_layout を使って階層ツリーを描画します。
In [2]:
from drawlib.canvas import show, setup
from drawlib.lines import lines
from drawlib.shapes import rectangle
from drawlib.styles import Styles
from drawlib.text import text

setup(width=int(tree_layout.width), height=int(tree_layout.height), cwd=True)

for edge in tree_layout.edges:
    lines(edge.points, arrow_head="->", style=Styles.PrimaryBold)

labels = {
    "platform": ("Cloud Platform", Styles.PrimaryFlat, Styles.WhiteBold),
    "compute": ("Compute Engine", Styles.Neutral, Styles.DarkBold),
    "storage": ("Object Storage", Styles.PrimaryNeutral, Styles.DarkBold),
    "network": ("Global Mesh", Styles.Neutral, Styles.DarkBold),
}

for nid, (label, box_style, txt_style) in labels.items():
    n = tree_layout[nid]
    rectangle(n.xy, width=n.width, height=n.height, style=box_style.patch(shape_r=1.8))
    text(n.xy, label, style=txt_style.patch(text_size=10.5))

show()
Out [2]: