05. クラウド構成図とソフトウェアフロー図
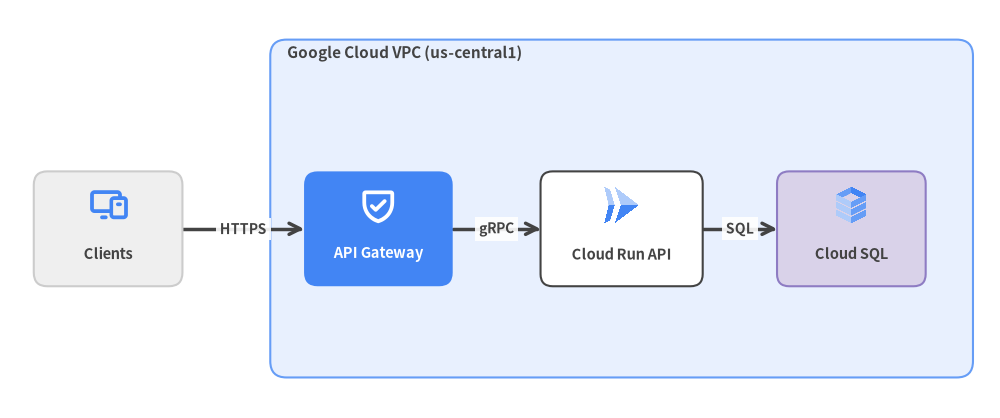
drawlib.diagrams は 6 種類の専門ダイアグラム(ArchitectureDiagram、FlowDiagram、SequenceDiagram、StateDiagram、ClassDiagram、ErDiagram)を提供します。
View Drawlib Python Code
from drawlib.canvas import save, setup
from drawlib.diagrams.architecture import (
    ArchitectureDiagram,
    GcpIcon,
    Node,
    NodeGroup,
    PhosphorIcon,
)
from drawlib.styles import Styles

setup(width=148, height=62)

d = ArchitectureDiagram(
    node_style=Styles.PrimaryBold,
    node_text_style=Styles.DarkBold.patch(text_size=10.5),
    edge_style=Styles.DarkBold,
    edge_text_style=Styles.DarkBold.patch(text_size=10.0),
    node_card_style=Styles.White,
)

client = d.add(
    Node(
        "Clients",
        width=22.0,
        height=17.0,
        icon=PhosphorIcon.DEVICES,
        icon_size=5.8,
        card_style=Styles.Neutral.patch(shape_r=2.0),
    ),
    xy=(14.0, 26.0),
)

vpc = d.add(
    NodeGroup(
        title="Google Cloud VPC (us-central1)",
        width=104.0,
        height=50.0,
        style=Styles.PrimaryNeutral.patch(shape_r=2.4),
        text_style=Styles.DarkBold.patch(text_size=11.0, halign="left"),
    ),
    xy=(38.0, 4.0),
)

gateway = vpc.add(
    Node(
        "API Gateway",
        width=22.0,
        height=17.0,
        icon=PhosphorIcon.SHIELD_CHECK,
        icon_size=5.8,
        style=Styles.WhiteBold,
        text_style=Styles.WhiteBold.patch(text_size=10.5),
        card_style=Styles.PrimaryFlat.patch(shape_r=2.0),
    ),
    xy=(16.0, 22.0),
)

worker = vpc.add(
    Node(
        "Cloud Run API",
        width=24.0,
        height=17.0,
        icon=GcpIcon.CLOUD_RUN,
        icon_size=6.0,
        card_style=Styles.White.patch(shape_r=1.8),
    ),
    xy=(52.0, 22.0),
)

db = vpc.add(
    Node(
        "Cloud SQL",
        width=22.0,
        height=17.0,
        icon=GcpIcon.CLOUD_SQL,
        icon_size=6.0,
        card_style=Styles.SecondaryNeutral.patch(shape_r=1.8),
    ),
    xy=(86.0, 22.0),
)

d.connect(client, gateway, label="HTTPS")
d.connect(gateway, worker, label="gRPC")
d.connect(worker, db, label="SQL")
d.draw(xy=(2.0, 2.0))

save()
1. Python セルでフローステップを確認する
まず Python セルで認証フローの各ステップを確認します。
In [setup]:
!pip install -q drawlib
In [1]:
flow_steps = [
    ("req", "Incoming Request"),
    ("auth", "Token Valid?"),
    ("allow", "Route to Worker"),
    ("deny", "Return 401"),
]
print("Flow steps:", [step[0] for step in flow_steps])
Out [1]:
Flow steps: ['req', 'auth', 'allow', 'deny']
2. FlowDiagram による条件分岐フローの描画
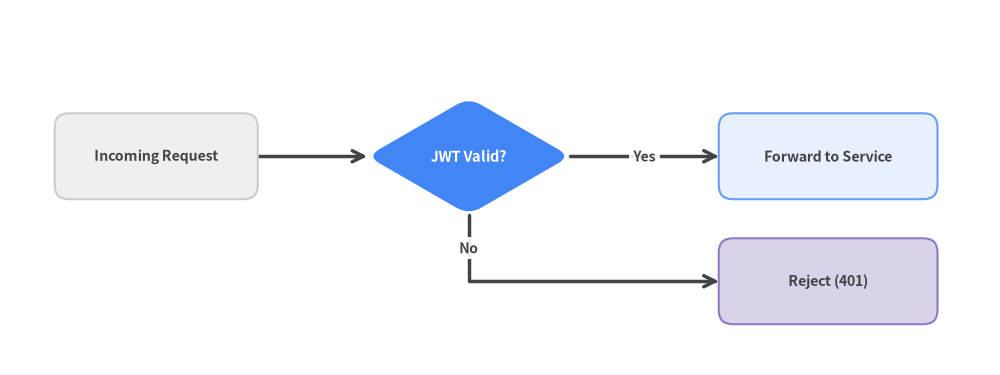
FlowDiagram を使って JWT トークン検証の条件分岐フローをインライン描画します。
In [2]:
from drawlib.canvas import show, setup
from drawlib.diagrams.flow import Decision, End, FlowDiagram, Process, Start
from drawlib.styles import Styles

setup(width=128, height=48, cwd=True)

flow = FlowDiagram(
    node_style=Styles.Neutral.patch(shape_r=1.8),
    edge_style=Styles.DarkBold,
    edge_text_style=Styles.DarkBold.patch(text_size=10.0),
)

n_start = flow.add(
    Start("Incoming Request", width=26.0, height=11.0, text_style=Styles.DarkBold.patch(text_size=10.2)),
    xy=(18.0, 26.0),
)
n_check = flow.add(
    Decision(
        "JWT Valid?",
        width=26.0,
        height=15.0,
        style=Styles.PrimaryFlat,
        text_style=Styles.WhiteBold.patch(text_size=10.5),
    ),
    xy=(58.0, 26.0),
)
n_allow = flow.add(
    Process(
        "Forward to Service",
        width=28.0,
        height=11.0,
        style=Styles.PrimaryNeutral,
        text_style=Styles.DarkBold.patch(text_size=10.2),
    ),
    xy=(104.0, 26.0),
)
n_deny = flow.add(
    End(
        "Reject (401)",
        width=28.0,
        height=11.0,
        style=Styles.SecondaryNeutral,
        text_style=Styles.DarkBold.patch(text_size=10.2),
    ),
    xy=(104.0, 10.0),
)

flow.connect(n_start, n_check)
flow.connect(n_check, n_allow, label="Yes", start_side="right", end_side="left")
flow.connect(n_check, n_deny, label="No", start_side="bottom", end_side="left", routing="orthogonal")
flow.draw(xy=(2.0, 2.0))

show()
Out [2]: