04. SmartArts:KPI カード・パイプライン・テーブル
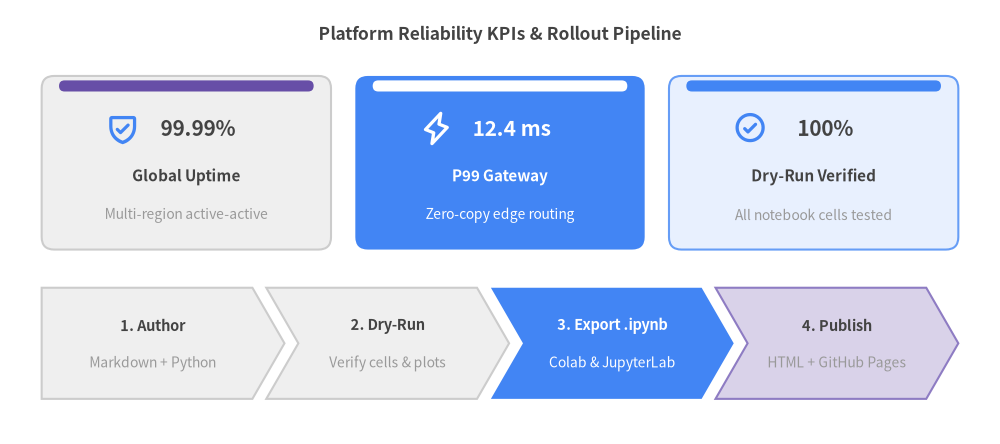
drawlib.smartarts は、整列や余白計算を自動化する 18 種類の構造化コンポーネント(KpiCards、ChevronProcess、Table、TreeNode、MindMapNode、Roadmap、Cycle、GridLayout、Pyramid、GeoMap、*Calendar など)を提供します。
View Drawlib Python Code
from drawlib.canvas import save, setup
from drawlib.icons import phosphor
from drawlib.smartarts import ChevronProcess, KpiCards
from drawlib.styles import Styles
from drawlib.text import text

setup(width=144, height=64)

text(
    (72.0, 59.0),
    "Platform Reliability KPIs & Rollout Pipeline",
    style=Styles.DarkBold.patch(text_size=12.5),
)

kpi = KpiCards(
    style=Styles.Neutral.patch(shape_r=1.8),
    metric_style=Styles.DarkBold.patch(text_size=15.0),
    text_style=Styles.DarkBold.patch(text_size=11.0),
    description_style=Styles.Muted.patch(text_size=10.0),
    accent_style=Styles.SecondaryFlat,
    icon_style=Styles.PrimaryBold,
    accent_position="top_bar",
    metric_layout="top_stack",
    spacing=3.5,
)
kpi.add("99.99%", "Global Uptime", "Multi-region active-active", icon=phosphor.shield_check)
kpi.add(
    "12.4 ms",
    "P99 Gateway",
    "Zero-copy edge routing",
    icon=phosphor.lightning,
    style=Styles.PrimaryFlat.patch(shape_r=1.8),
    metric_style=Styles.WhiteBold.patch(text_size=15.0),
    text_style=Styles.WhiteBold.patch(text_size=11.0),
    description_style=Styles.White.patch(text_size=10.0),
    accent_style=Styles.WhiteFlat,
    icon_style=Styles.WhiteBold,
)
kpi.add(
    "100%",
    "Dry-Run Verified",
    "All notebook cells tested",
    icon=phosphor.check_circle,
    style=Styles.PrimaryNeutral.patch(shape_r=1.8),
    accent_style=Styles.PrimaryFlat,
)
kpi.draw(xy=(6.0, 28.0), width=132.0, height=25.0, columns=3)

pipeline = ChevronProcess(
    style=Styles.Neutral,
    text_style=Styles.DarkBold.patch(text_size=10.5),
    description_style=Styles.Muted.patch(text_size=10.0),
    corner_angle=60.0,
    spacing=2.0,
    flat_left_end=True,
)
pipeline.add("1. Author", description="Markdown + Python")
pipeline.add("2. Dry-Run", description="Verify cells & plots")
pipeline.add(
    "3. Export .ipynb",
    description="Colab & JupyterLab",
    style=Styles.PrimaryFlat,
    text_style=Styles.WhiteBold.patch(text_size=10.5),
    description_style=Styles.White.patch(text_size=10.0),
)
pipeline.add("4. Publish", description="HTML + GitHub Pages", style=Styles.SecondaryNeutral)
pipeline.draw(xy=(6.0, 6.5), width=132.0, height=16.0)

save()
1. Python セルでテーブル行データを準備する
上から下へ読むコンポーネント(Table、TreeNode、BulletPoints、SourceCode)は 左上座標 (x0, y_top) をアンカーとし、下方向(-Y)へ展開されます。
In [setup]:
!pip install -q drawlib
In [1]:
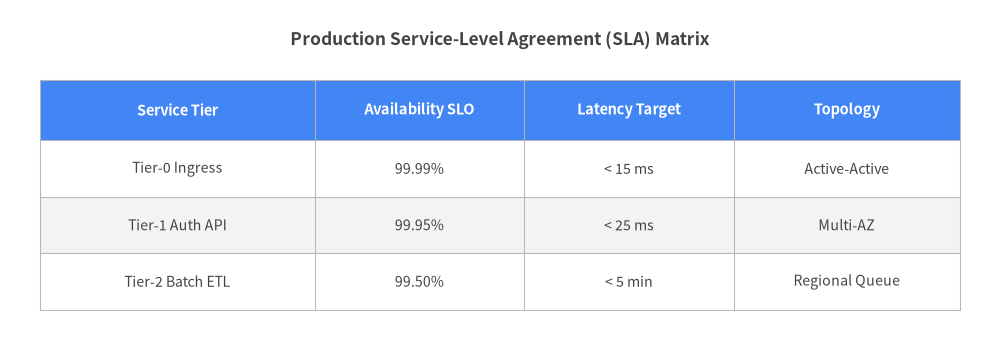
sla_matrix = [
    ["Service Tier", "Availability SLO", "Latency Target", "Topology"],
    ["Tier-0 Ingress", "99.99%", "< 15 ms", "Active-Active"],
    ["Tier-1 Auth API", "99.95%", "< 25 ms", "Multi-AZ"],
    ["Tier-2 Batch ETL", "99.50%", "< 5 min", "Regional Queue"],
]
print(f"Prepared {len(sla_matrix) - 1} SLA matrix rows.")
Out [1]:
Prepared 3 SLA matrix rows.
2. Table SmartArt のインライン描画
前のセルで定義した sla_matrix を Table コンポーネントで描画します。
In [2]:
from drawlib.canvas import show, setup
from drawlib.smartarts import Table
from drawlib.styles import Colors, Styles
from drawlib.text import text

setup(width=124, height=44, cwd=True)

text((62.0, 39.0), "Production Service-Level Agreement (SLA) Matrix", style=Styles.DarkBold.patch(text_size=12.5))

tbl = Table(
    cell_style=Styles.White,
    text_style=Styles.Dark.patch(text_size=10.2),
    header_cell_style=Styles.PrimaryFlat,
    header_text_style=Styles.WhiteBold.patch(text_size=10.5),
    border_style=Styles.MutedThin,
)
tbl.set_style_cell_evenodd(
    even_color=Colors.Gray1,
    even_text_style=Styles.Dark.patch(text_size=10.2),
    odd_color=Colors.White,
    odd_text_style=Styles.Dark.patch(text_size=10.2),
)
tbl.set_style_cell_header(
    background_color=Colors.Primary,
    text_style=Styles.WhiteBold.patch(text_size=10.5),
)
tbl.draw_flexible(
    xy=(5.0, 34.0),
    column_widths=[34.0, 26.0, 26.0, 28.0],
    row_heights=[7.5, 7.0, 7.0, 7.0],
    data=sla_matrix,
    align="top_left",
)

show()
Out [2]: