drawlib.charts.line
2D line chart builder supporting straight polygonal segments, smooth cubic splines, customizable vertex markers, stroke patterns, and decoupled legends. Import from drawlib.charts.line (from drawlib.charts.line import Axis, LineChart, Series).
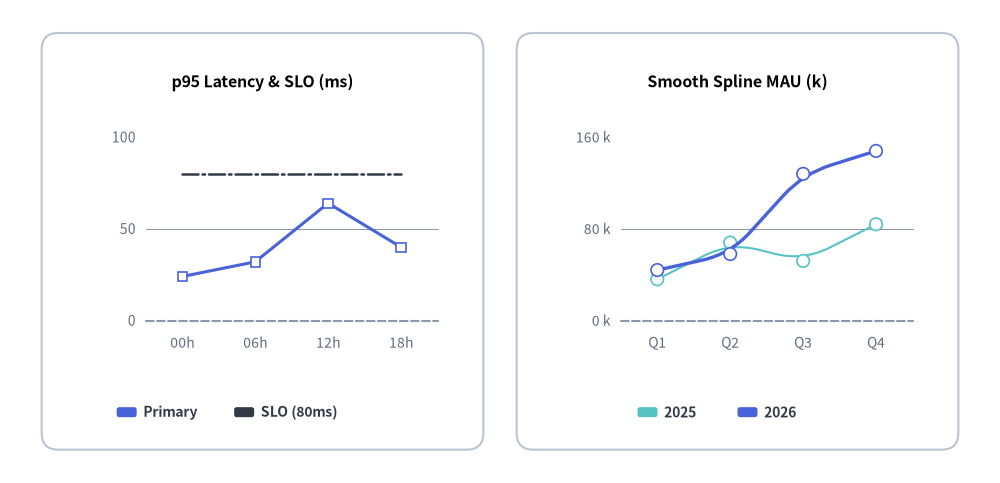
Source Code
from drawlib.canvas import save, setup
from drawlib.charts.line import LineChart
from drawlib.shapes import rectangle
from drawlib.styles import Colors, Styles

setup(width=120, height=58)

card_style = Styles.Neutral.patch(shape_r=2.0, shape_line_color=Colors.Gray4, shape_fill_color=Colors.White)
rectangle((31.5, 29.0), width=53.0, height=50.0, style=card_style)
rectangle((88.5, 29.0), width=53.0, height=50.0, style=card_style)

# Left: Straight Segments with Vertex Markers & SLO Ceiling
left = LineChart(
    axis_line_style=Styles.MutedDashed,
    categories=["00h", "06h", "12h", "18h"],
    width=48.0,
    height=37.0,
    smooth=False,
    show_points=True,
    axis_text_style=Styles.Muted.patch(text_size=10.0),
    grid_style=Styles.MutedThin,
    title="p95 Latency & SLO (ms)",
    title_style=Styles.BlackBold.patch(text_size=11.5),
)
left.add_series("Primary", [24.0, 32.0, 64.0, 40.0], style=Styles.PrimaryFlat, line_width=2.2, point_shape="square")
left.add_series("SLO (80ms)", [80.0, 80.0, 80.0, 80.0], style=Styles.DarkFlat, line_width=1.8, line_style="dashdot", point_shape="none")
left.configure_y_axis(min_value=0.0, max_value=100.0, tick_step=50.0)
left.draw(xy=(7.5, 13.5))
left.draw_legend(xy=(14.0, 8.5), text_style=Styles.DarkBold.patch(text_size=10.0), orientation="horizontal", item_gap=2.5)

# Right: Smooth Spline Multi-Series Growth
right = LineChart(
    axis_line_style=Styles.MutedDashed,
    categories=["Q1", "Q2", "Q3", "Q4"],
    width=48.0,
    height=37.0,
    smooth=True,
    show_points=True,
    point_size=0.75,
    axis_text_style=Styles.Muted.patch(text_size=10.0),
    grid_style=Styles.MutedThin,
    title="Smooth Spline MAU (k)",
    title_style=Styles.BlackBold.patch(text_size=11.5),
)
right.add_series("2025", [36.0, 68.0, 52.0, 84.0], style=Styles.SecondaryNeutral, line_width=2.0, line_style="dashed")
right.add_series("2026", [44.0, 58.0, 128.0, 148.0], style=Styles.PrimaryFlat, line_width=2.4)
right.configure_y_axis(min_value=0.0, max_value=160.0, tick_step=80.0, unit="k")
right.draw(xy=(64.5, 13.5))
right.draw_legend(xy=(76.5, 8.5), text_style=Styles.DarkBold.patch(text_size=10.0), orientation="horizontal")

save()
classAxis#
Represents a coordinate axis (value axis or category axis) of a Cartesian chart, controlling linear/logarithmic scaling, domain bounds, ticks, gridlines, and formatting.
class Axis:
    def __init__(
        self,
        scale: ScaleType = "linear",
        min_value: float | None = None,
        max_value: float | None = None,
        ticks: list[float] | None = None,
        tick_step: float | None = None,
        format: FormatterType = None,
        unit: str = "",
        label: str = "",
        show_grid: bool = True,
        grid_style: Style | None = None,
        show_axis_line: bool = True,
        line_style: Style | None = None,
        show_ticks: bool = True,
        tick_label_style: Style | None = None,
        label_style: Style | None = None,
    ) -> None: ...
Parameters#
| Parameter | Type | Default | Description |
|---|---|---|---|
scale |
"linear" | "log" |
"linear" |
Linear nice-number scaling or base-10 logarithmic (log10) scaling. |
min_value |
float | None |
None |
Explicit minimum axis domain bound. Auto-computed when None. |
max_value |
float | None |
None |
Explicit maximum axis domain bound. Auto-computed when None. |
ticks |
list[float] | None |
None |
Explicit list of tick values overriding automatic tick generation. |
tick_step |
float | None |
None |
Explicit linear interval between ticks. |
format |
FormatterType |
None |
Format string or callable Callable[[float], str] used for tick labels and vertex values. |
unit |
str |
"" |
Unit suffix appended to formatted tick labels (e.g. "ms", "k"). |
label |
str |
"" |
Descriptive axis title text. |
show_grid |
bool |
True |
Whether to draw gridlines along this axis when chart grid_style is set. |
grid_style |
Style | None |
None |
Optional per-axis Style override for gridlines. |
show_axis_line |
bool |
True |
Whether to draw the axis baseline stroke. |
line_style |
Style | None |
None |
Optional per-axis Style override for the axis baseline. |
show_ticks |
bool |
True |
Whether to draw tick labels along this axis. |
tick_label_style |
Style | None |
None |
Optional per-axis Style override for tick labels. |
label_style |
Style | None |
None |
Optional Style override for the axis label title. |
Methods#
configure
def configure(
    self,
    scale: ScaleType | None = None,
    min_value: float | None = None,
    max_value: float | None = None,
    ticks: list[float] | None = None,
    tick_step: float | None = None,
    format: FormatterType = None,
    unit: str | None = None,
    label: str | None = None,
    show_grid: bool | None = None,
    grid_style: Style | None = None,
    show_axis_line: bool | None = None,
    line_style: Style | None = None,
    show_ticks: bool | None = None,
    tick_label_style: Style | None = None,
    label_style: Style | None = None,
) -> None
Updates multiple axis configuration options in place.
format_value
def format_value(self, value: float) -> str
Formats a numeric value into a display label string using format and unit.
typeDrawDirection#
Spatial partial-rendering direction used with Series.draw_ratio (0.0 to 1.0) for progressive line chart animations.
DrawDirection = Literal["bottom_to_top", "left_to_right"]
| Literal Value | LineChart Behavior |
|---|---|
"left_to_right" |
Extends the polyline or smooth spline continuously from left to right along arc length; vertex markers appear as reached (default). |
"bottom_to_top" |
Raises all series vertices simultaneously from the baseline toward their target y values. |
typeFormatterType#
Union type for formatting axis tick labels and vertex value annotations (y_axis.format).
FormatterType = str | Callable[[float], str] | None
str: Python format string (e.g."{:.1f}","${:,.0f}").Callable[[float], str]: Custom formatter callable accepting afloatand returning astr.None: Automatic compact numeric formatting.
typeLegendPosition#
Literal type representing preset legend placement identifiers.
LegendPosition = Literal["top", "bottom", "right", "none", "auto"]
- Note:
LineChartplaces legends explicitly on the canvas viaLineChart.draw_legend().
classLineChart#
2D line chart builder supporting straight polygonal segments (smooth=False) and smooth cubic spline curves (smooth=True) over ordered categories.
- Coordinate Anchor: Bottom-Left
(x0, y0)by default indraw(xy=..., align="bottom_left"), or geometric center whenalign="center". - Vertex Value Formatting: When
value_text_styleis provided, vertex labels are formatted viay_axis.format_value(v)(configured viaconfigure_y_axis(format=..., unit=...)).
class LineChart:
    def __init__(
        self,
        *,
        axis_line_style: Style,
        categories: list[str],
        width: float = 80.0,
        height: float = 50.0,
        show_points: bool = True,
        point_shape: PointShape = "circle",
        point_size: float = 0.7,
        smooth: bool = False,
        axis_text_style: Style | None = None,
        grid_style: Style | None = None,
        value_text_style: Style | None = None,
        background_style: Style | None = None,
        title: str = "",
        title_style: Style | None = None,
    ) -> None: ...
Parameters#
| Parameter | Type | Default | Description |
|---|---|---|---|
axis_line_style |
Style |
Required | Mandatory style for the Cartesian axes baseline and ticks. |
categories |
list[str] |
Required | Ordered category labels along the horizontal X-axis. |
width |
float |
80.0 |
Total chart bounding box width in canvas units. |
height |
float |
50.0 |
Total chart bounding box height in canvas units. |
show_points |
bool |
True |
Whether to render vertex markers along series lines. |
point_shape |
PointShape |
"circle" |
Default vertex marker shape ("circle", "square", "rhombus", "triangle", "none"). |
point_size |
float |
0.7 |
Default marker radius (or half-width) in canvas units. |
smooth |
bool |
False |
When True, interpolates smooth spline curves through vertices (3+ points). |
axis_text_style |
Style | None |
None |
Style for Y-axis tick labels and X-axis category names. Omitted when None. |
grid_style |
Style | None |
None |
Style for horizontal Y-axis gridlines. Omitted when None. |
value_text_style |
Style | None |
None |
Style for numeric labels drawn above vertex markers. Omitted when None. |
background_style |
Style | None |
None |
Outer chart background card style. Omitted when None. |
title |
str |
"" |
Title text displayed at the top of the chart container. |
title_style |
Style | None |
None |
Typography style required to render title. Omitted when None. |
Methods & Properties#
add_series
def add_series(
    self,
    name: str,
    values: list[float],
    style: Style,
    line_width: float = 2.0,
    line_style: LineStyle = "solid",
    point_shape: PointShape | None = None,
    point_size: float | None = None,
    legend_text_style: Style | None = None,
    *,
    show: bool = True,
    draw_ratio: float = 1.0,
    draw_direction: DrawDirection = "left_to_right",
) -> Series
Adds a new line series to the chart and returns the mutable Series instance. Passing point_shape="none" suppresses both vertex markers and value_text_style labels on that series (ideal for flat reference or threshold lines).
configure_x_axis
def configure_x_axis(
    self,
    scale: ScaleType | None = None,
    min_value: float | None = None,
    max_value: float | None = None,
    ticks: list[float] | None = None,
    tick_step: float | None = None,
    format: FormatterType = None,
    unit: str | None = None,
    label: str | None = None,
    show_grid: bool | None = None,
    grid_style: Style | None = None,
    show_axis_line: bool | None = None,
    line_style: Style | None = None,
    show_ticks: bool | None = None,
    tick_label_style: Style | None = None,
) -> Axis
Configures horizontal X-axis parameters in a single call and returns x_axis.
configure_y_axis
def configure_y_axis(
    self,
    scale: ScaleType | None = None,
    min_value: float | None = None,
    max_value: float | None = None,
    ticks: list[float] | None = None,
    tick_step: float | None = None,
    format: FormatterType = None,
    unit: str | None = None,
    label: str | None = None,
    show_grid: bool | None = None,
    grid_style: Style | None = None,
    show_axis_line: bool | None = None,
    line_style: Style | None = None,
    show_ticks: bool | None = None,
    tick_label_style: Style | None = None,
) -> Axis
Configures vertical Y-axis scale, bounds, ticks, formatters, and labels in a single call and returns y_axis.
draw
def draw(
    self,
    xy: tuple[float, float] = (0.0, 0.0),
    *,
    width: float | None = None,
    height: float | None = None,
    align: Literal["bottom_left", "center"] = "bottom_left",
    scale: float = 1.0,
) -> None
Renders the line chart onto the canvas anchored at xy (Bottom-Left (x0, y0) by default, or geometric center when align="center").
draw_legend
def draw_legend(
    self,
    xy: tuple[float, float],
    text_style: Style,
    orientation: Orientation = "vertical",
    swatch_width: float = 2.4,
    swatch_height: float = 1.2,
    item_gap: float = 4.0,
    *,
    scale: float = 1.0,
) -> None
Renders a standalone series legend at xy ("vertical" or "horizontal").
get_size
def get_size(self) -> tuple[float, float]
Returns (width, height) of the chart container in canvas units.
series *(property)*
@property
def series(self) -> list[Series]
Returns a list copy of Series instances registered with this chart.
typeLineStyle#
Literal type specifying stroke dash patterns for series lines (add_series(..., line_style=...)).
LineStyle = Literal["solid", "dashed", "dotted", "dashdot"]
| Literal Value | Description |
|---|---|
"solid" |
Continuous unbroken stroke (default). |
"dashed" |
Evenly spaced dash segments (-- -- --), ideal for baseline comparisons. |
"dotted" |
Fine dot sequence (· · · ·), suited for secondary or replica series. |
"dashdot" |
Alternating dash-dot pattern (-·-·), suited for SLA/SLO threshold ceilings. |
typePointShape#
Literal type specifying the geometric marker drawn at series vertices.
PointShape = Literal["circle", "square", "rhombus", "triangle", "none"]
| Literal Value | Description |
|---|---|
"circle" |
Circular vertex marker (default). |
"square" |
Axis-aligned square vertex marker. |
"rhombus" |
Rotated diamond (45°) vertex marker. |
"triangle" |
Upward-pointing equilateral triangle marker. |
"none" |
Hides vertex markers (and suppresses value_text_style labels on that series). |
classSeries#
Mutable data model representing a registered line series in a LineChart.
class Series:
    def __init__(
        self,
        name: str,
        values: list[float],
        style: Style,
        line_width: float = 2.0,
        line_style: LineStyle = "solid",
        point_shape: PointShape = "circle",
        point_size: float = 0.7,
        legend_text_style: Style | None = None,
        *,
        show: bool = True,
        draw_ratio: float = 1.0,
        draw_direction: DrawDirection = "left_to_right",
    ) -> None: ...
Parameters & Attributes#
| Parameter / Attribute | Type | Default | Description |
|---|---|---|---|
name |
str |
Required | Series display name shown in draw_legend(). |
values |
list[float] |
Required | Numeric values corresponding to LineChart.categories. |
style |
Style |
Required | Stroke and marker Style (line_color / shape_fill_color). |
line_width |
float |
2.0 |
Stroke width of the line or spline curve. |
line_style |
LineStyle |
"solid" |
Stroke dash pattern ("solid", "dashed", "dotted", "dashdot"). |
point_shape |
PointShape |
"circle" |
Marker geometry drawn at each vertex. |
point_size |
float |
0.7 |
Marker radius (or half-width) in canvas units. |
legend_text_style |
Style | None |
None |
Optional custom text style for this series in draw_legend(). |
show |
bool |
True |
Toggles visibility while preserving full-dataset axis domain scaling. |
draw_ratio |
float |
1.0 |
Spatial rendering progress (0.0 to 1.0) for animations. |
draw_direction |
DrawDirection |
"left_to_right" |
Partial rendering direction ("left_to_right" or "bottom_to_top"). |