drawlib.charts.gantt
2D Gantt project schedule and roadmap chart builder supporting section banners, progress-filled task bars, diamond milestones, orthogonal task dependencies, and vertical timeline markers. Import from drawlib.charts.gantt (from drawlib.charts.gantt import Dependency, GanttChart, Marker, Milestone, Section, Task).
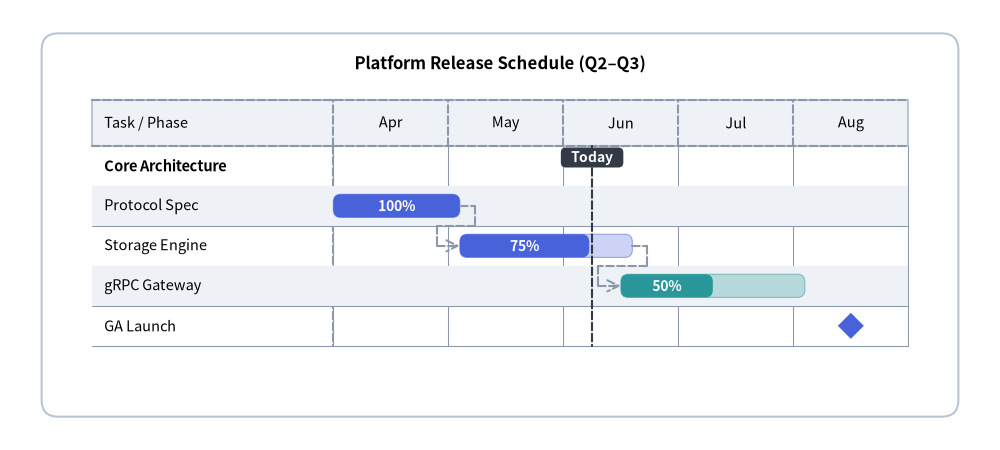
Source Code
from drawlib.canvas import save, setup
from drawlib.charts.gantt import GanttChart
from drawlib.shapes import rectangle
from drawlib.styles import Colors, Styles

setup(width=120, height=54)

card_style = Styles.Neutral.patch(shape_r=2.0, shape_line_color=Colors.Gray4, shape_fill_color=Colors.White)
rectangle((60.0, 27.0), width=110.0, height=46.0, style=card_style)

chart = GanttChart(
    columns=["Apr", "May", "Jun", "Jul", "Aug"],
    axis_line_style=Styles.MutedDashed,
    axis_text_style=Styles.Black.patch(text_size=10.5),
    grid_style=Styles.MutedThin,
    header_style=Styles.Neutral,
    zebra_style=Styles.NeutralFlat,
    progress_text_style=Styles.WhiteBold.patch(text_size=10.0),
    width=102.0,
    label_width=29.0,
    header_height=5.5,
    row_height=4.8,
    bar_radius=0.9,
    title="Platform Release Schedule (Q2–Q3)",
    title_style=Styles.BlackBold.patch(text_size=12.0),
)

chart.add_section("Core Architecture", text_style=Styles.BlackBold.patch(text_size=10.5))
t1 = chart.add_task("Protocol Spec", start="Apr", end=1.1, style=Styles.PrimaryFlat, progress=1.0)
t2 = chart.add_task("Storage Engine", start=1.1, end=2.6, style=Styles.PrimaryFlat, progress=0.75)
t3 = chart.add_task(
    "gRPC Gateway",
    start=2.5,
    end=4.1,
    style=Styles.SecondaryFlat,
    progress=0.50,
)
chart.add_milestone("GA Launch", at=4.5, style=Styles.PrimaryFlat)

chart.add_dependency(t1, t2)
chart.add_dependency(t2, t3)
chart.add_marker(at=2.25, style=Styles.DarkDashed, label="Today", label_style=Styles.WhiteBold.patch(text_size=10.0))

chart.draw(xy=(9.0, 6.0))
save()
classDependency#
Mutable data model representing an orthogonal connector arrow linking two scheduled Task rows in a GanttChart.
- Visibility Cascading: Automatically hidden whenever either
from_taskorto_taskhasshow=Falseordraw_ratio == 0.0.
class Dependency:
    def __init__(
        self,
        from_task: Task,
        to_task: Task,
        style: Style | None = None,
        show: bool = True,
    ) -> None: ...
Parameters & Attributes#
| Parameter / Attribute | Type | Default | Description |
|---|---|---|---|
from_task |
Task |
Required | Upstream prerequisite Task where the arrow originates. |
to_task |
Task |
Required | Downstream dependent Task where the arrowhead terminates. |
style |
Style | None |
None |
Optional connector Style override (None uses default orthogonal arrow stroke). |
show |
bool |
True |
Toggles dependency arrow visibility. |
typeDrawDirection#
Spatial partial-rendering direction used with Task.draw_ratio (0.0 to 1.0) for progressive schedule animations.
DrawDirection = Literal["bottom_to_top", "left_to_right"]
| Literal Value | GanttChart Task Behavior |
|---|---|
"left_to_right" |
Extends the task bar horizontally from start toward start + (end - start) * draw_ratio (default). |
"bottom_to_top" |
Grows the task bar vertically upward from its bottom edge (bar_height * draw_ratio). |
classGanttChart#
2D Gantt project schedule chart builder stacking sections, tasks, and milestones top-to-bottom across horizontal timeline columns.
- Coordinate Anchor: Bottom-Left
(x0, y0)by default indraw(xy=..., align="bottom_left"), or geometric center whenalign="center". - Time Coordinate Indexing (
start,end,at): Accepts either an exact column name fromcolumns(start="Apr"= left edge,end="Apr"= right edge,at="Jun"= column midpoint) or afloatcolumn offset (0.0= left edge of column0,1.5= midpoint of column1).
class GanttChart:
    def __init__(
        self,
        *,
        columns: list[str],
        axis_line_style: Style,
        axis_text_style: Style | None = None,
        header_style: Style | None = None,
        grid_style: Style | None = None,
        zebra_style: Style | None = None,
        progress_text_style: Style | None = None,
        background_style: Style | None = None,
        title: str = "",
        title_style: Style | None = None,
        width: float = 90.0,
        height: float | None = None,
        row_height: float = 4.5,
        header_height: float = 5.5,
        label_width: float = 24.0,
        bar_radius: float = 0.8,
    ) -> None: ...
Parameters#
| Parameter | Type | Default | Description |
|---|---|---|---|
columns |
list[str] |
Required | Ordered timeline column labels along the top header band (at least 1 required). |
axis_line_style |
Style |
Required | Mandatory style for column divider borders and header baseline. |
axis_text_style |
Style | None |
None |
Style for column header labels and left-column task/milestone names. Omitted when None. |
header_style |
Style | None |
None |
Fill/border style for the top column header band. Omitted when None. |
grid_style |
Style | None |
None |
Style for vertical timeline column separator lines across rows. Omitted when None. |
zebra_style |
Style | None |
None |
Style for alternating horizontal row background stripes. Omitted when None. |
progress_text_style |
Style | None |
None |
Default typography style for task completion percentage labels ("80%"). Omitted when None. |
background_style |
Style | None |
None |
Outer chart background card style. Omitted when None. |
title |
str |
"" |
Chart title text displayed above the schedule header. |
title_style |
Style | None |
None |
Typography style required to render title. Omitted when None. |
width |
float |
90.0 |
Overall chart bounding box width in canvas units. |
height |
float | None |
None |
Overall chart height. Dynamically computed from total row count when None. |
row_height |
float |
4.5 |
Vertical height per section, task, or milestone row in canvas units. |
header_height |
float |
5.5 |
Vertical height of the top timeline column header band. |
label_width |
float |
24.0 |
Horizontal width allocated for the left-hand row label column. |
bar_radius |
float |
0.8 |
Default corner rounding radius for task bars when task.style.shape_r is None. |
Methods & Properties#
add_dependency
def add_dependency(
    self,
    from_task: Task,
    to_task: Task,
    style: Style | None = None,
    *,
    show: bool = True,
) -> Dependency
Adds an orthogonal dependency arrow connecting from_task to to_task and returns the mutable Dependency instance.
add_marker
def add_marker(
    self,
    at: str | float,
    style: Style,
    label: str = "",
    label_style: Style | None = None,
    *,
    show: bool = True,
) -> Marker
Adds a full-height vertical reference line at at with an optional top badge (label + label_style) and returns the mutable Marker instance.
add_milestone
def add_milestone(
    self,
    name: str,
    at: str | float,
    style: Style,
    *,
    show: bool = True,
) -> Milestone
Adds a milestone row with a diamond marker anchored at at and returns the mutable Milestone instance.
add_section
def add_section(
    self,
    name: str,
    style: Style | None = None,
    text_style: Style | None = None,
    *,
    show: bool = True,
) -> Section
Adds a category section divider banner row and returns the mutable Section instance.
add_task
def add_task(
    self,
    name: str,
    start: str | float,
    end: str | float,
    style: Style,
    progress: float = 0.0,
    progress_text_style: Style | None = None,
    *,
    show: bool = True,
    draw_ratio: float = 1.0,
    draw_direction: DrawDirection = "left_to_right",
) -> Task
Adds a scheduled task bar spanning [start, end] with optional completion progress (0.0 to 1.0) and returns the mutable Task instance.
columns *(property)*
@property
def columns(self) -> list[str]
Returns a list copy of timeline column labels.
dependencies *(property)*
@property
def dependencies(self) -> list[Dependency]
Returns a list copy of registered Dependency arrows.
draw
def draw(
    self,
    xy: tuple[float, float] = (0.0, 0.0),
    *,
    width: float | None = None,
    height: float | None = None,
    align: Literal["bottom_left", "center"] = "bottom_left",
    scale: float = 1.0,
) -> None
Renders the Gantt chart onto the canvas anchored at xy (Bottom-Left (x0, y0) by default, or geometric center when align="center").
get_size
def get_size(self) -> tuple[float, float]
Computes and returns the total (width, height) dimensions of the chart container.
items *(property)*
@property
def items(self) -> list[Task | Section | Milestone]
Returns a list copy of registered schedule rows (Task, Section, Milestone) in top-to-bottom order.
markers *(property)*
@property
def markers(self) -> list[Marker]
Returns a list copy of registered vertical Marker reference lines.
classMarker#
Mutable data model representing a full-height vertical reference line across all schedule rows (e.g. "Today" or "Code Freeze").
class Marker:
    def __init__(
        self,
        at: str | float,
        style: Style,
        label: str = "",
        label_style: Style | None = None,
        show: bool = True,
    ) -> None: ...
Parameters & Attributes#
| Parameter / Attribute | Type | Default | Description |
|---|---|---|---|
at |
str | float |
Required | Column name (midpoint) or floating-point column boundary offset. |
style |
Style |
Required | Vertical reference line and badge fill Style. |
label |
str |
"" |
Optional badge text displayed above the vertical marker line. |
label_style |
Style | None |
None |
Typography style for label. |
show |
bool |
True |
Toggles vertical marker visibility. |
classMilestone#
Mutable data model representing a zero-duration diamond milestone event row in a GanttChart.
class Milestone:
    def __init__(
        self,
        name: str,
        at: str | float,
        style: Style,
        show: bool = True,
    ) -> None: ...
Parameters & Attributes#
| Parameter / Attribute | Type | Default | Description |
|---|---|---|---|
name |
str |
Required | Milestone label displayed in the left-hand column. |
at |
str | float |
Required | Column name (midpoint) or floating-point timeline position of the diamond marker. |
style |
Style |
Required | Diamond marker fill and border Style. |
show |
bool |
True |
Toggles milestone marker visibility while preserving row layout spacing. |
classSection#
Mutable data model representing a full-width category section divider row in a GanttChart.
class Section:
    def __init__(
        self,
        name: str,
        style: Style | None = None,
        text_style: Style | None = None,
        show: bool = True,
    ) -> None: ...
Parameters & Attributes#
| Parameter / Attribute | Type | Default | Description |
|---|---|---|---|
name |
str |
Required | Section header title text. |
style |
Style | None |
None |
Optional banner rectangle fill/border Style override. |
text_style |
Style | None |
None |
Optional typography style override for name (falls back to GanttChart.axis_text_style). |
show |
bool |
True |
Toggles section banner visibility while preserving row layout spacing. |
classTask#
Mutable data model representing a scheduled task bar spanning [start, end] in a GanttChart.
class Task:
    def __init__(
        self,
        name: str,
        start: str | float,
        end: str | float,
        style: Style,
        progress: float = 0.0,
        progress_text_style: Style | None = None,
        show: bool = True,
        draw_ratio: float = 1.0,
        draw_direction: DrawDirection = "left_to_right",
    ) -> None: ...
Parameters & Attributes#
| Parameter / Attribute | Type | Default | Description |
|---|---|---|---|
name |
str |
Required | Task name displayed in the left-hand label column. |
start |
str | float |
Required | Start column name (left edge) or floating-point timeline offset. |
end |
str | float |
Required | End column name (right edge) or floating-point timeline offset. |
style |
Style |
Required | Solid task bar Style (uncompleted portion renders as a translucent tint when progress > 0). |
progress |
float |
0.0 |
Completion ratio clamped to [0.0, 1.0]. |
progress_text_style |
Style | None |
None |
Per-task override for completion percentage text (falls back to GanttChart.progress_text_style). |
show |
bool |
True |
Toggles task bar visibility (and hides connected Dependency arrows) while preserving row position. |
draw_ratio |
float |
1.0 |
Spatial rendering progress (0.0 to 1.0) for animations. |
draw_direction |
DrawDirection |
"left_to_right" |
Partial rendering direction ("left_to_right" horizontal span or "bottom_to_top" vertical height). |