drawlib.charts.heatmap
2D matrix grid heatmaps (HeatmapChart) with auto-contrasting cell labels and spatial thermal hotspot overlays (HeatmapOverlay) for architecture, class, and geographic diagrams. Import from drawlib.charts.heatmap (from drawlib.charts.heatmap import Cell, HeatmapChart, HeatmapOverlay, Row, Spot).
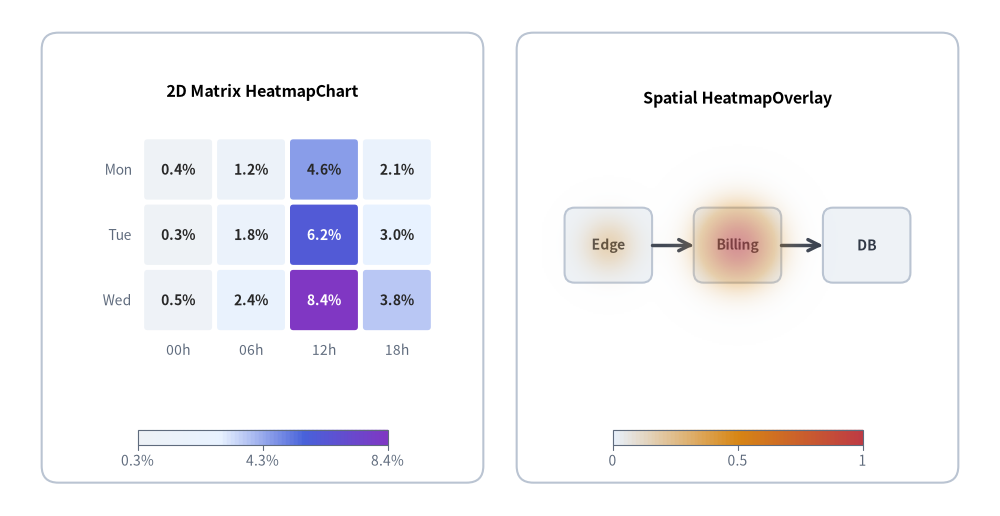
Source Code
from drawlib.canvas import save, setup
from drawlib.charts.heatmap import HeatmapChart, HeatmapOverlay
from drawlib.lines import line
from drawlib.shapes import rectangle
from drawlib.styles import Colors, Styles

setup(width=120, height=62)

card_style = Styles.Neutral.patch(shape_r=2.0, shape_line_color=Colors.Gray4, shape_fill_color=Colors.White)
rectangle((31.5, 31.0), width=53.0, height=54.0, style=card_style)
rectangle((88.5, 31.0), width=53.0, height=54.0, style=card_style)

# Left: 2D Matrix HeatmapChart + Continuous Colorbar
matrix = HeatmapChart(
    styles=[Styles.Neutral, Styles.PrimaryNeutral, Styles.PrimaryFlat, Styles.AccentFlat],
    x_categories=["00h", "06h", "12h", "18h"],
    axis_text_style=Styles.Muted.patch(text_size=10.0),
    value_text_style=Styles.BlackBold.patch(text_size=10.0),
    width=47.0,
    height=37.0,
    cell_gap=0.6,
    cell_r=0.4,
    value_format="{:.1f}%",
    title="2D Matrix HeatmapChart",
    title_style=Styles.BlackBold.patch(text_size=11.5),
)
matrix.add_row("Mon", [0.4, 1.2, 4.6, 2.1])
matrix.add_row("Tue", [0.3, 1.8, 6.2, 3.0])
matrix.add_row("Wed", [0.5, 2.4, 8.4, 3.8])
matrix.draw(xy=(8.0, 16.5))
matrix.draw_colorbar(xy=(16.5, 8.5), text_style=Styles.Muted.patch(text_size=10.0), length=30.0, thickness=1.8, num_ticks=3)

# Right: Spatial Thermal HeatmapOverlay over Service Nodes
rectangle((73.0, 32.5), width=10.5, height=9.0, style=Styles.Neutral.patch(shape_r=1.2), text="Edge", text_style=Styles.DarkBold.patch(text_size=10.0))
rectangle((88.5, 32.5), width=10.5, height=9.0, style=Styles.Neutral.patch(shape_r=1.2), text="Billing", text_style=Styles.DarkBold.patch(text_size=10.0))
rectangle((104.0, 32.5), width=10.5, height=9.0, style=Styles.Neutral.patch(shape_r=1.2), text="DB", text_style=Styles.DarkBold.patch(text_size=10.0))
line((78.25, 32.5), (83.25, 32.5), arrow_head="->", style=Styles.DarkBold)
line((93.75, 32.5), (98.75, 32.5), arrow_head="->", style=Styles.DarkBold)

overlay = HeatmapOverlay(
    styles=[Styles.PrimaryNeutral, Styles.WarningFlat, Styles.DangerFlat],
    width=47.0,
    height=30.0,
    mode="smooth",
    max_alpha=0.55,
    title="Spatial HeatmapOverlay",
    title_style=Styles.BlackBold.patch(text_size=11.5),
)
overlay.add_spot((23.5, 15.0), value=0.95, radius=10.5)
overlay.add_spot((8.0, 15.0), value=0.45, radius=7.5)
overlay.draw(xy=(65.0, 17.5))
overlay.draw_colorbar(xy=(73.5, 8.5), text_style=Styles.Muted.patch(text_size=10.0), length=30.0, thickness=1.8, num_ticks=3)

save()
typeBlendMode#
Literal type controlling how overlapping Gaussian thermal hotspots accumulate intensity in HeatmapOverlay when mode="smooth".
BlendMode = Literal["add", "max"]
| Literal Value | Description |
|---|---|
"add" |
Sums overlapping hotspot intensities cumulatively (clamped to max_value) (default). |
"max" |
Takes the pointwise maximum intensity among overlapping hotspots without additive boosting. |
classCell#
Mutable data model representing a cell-level override in a HeatmapChart, registered via HeatmapChart.set_cell().
class Cell:
    def __init__(
        self,
        x: int,
        y: int,
        value: float | None,
        *,
        label: str = "",
        style: Style | None = None,
        show: bool = True,
    ) -> None: ...
Parameters & Attributes#
| Parameter / Attribute | Type | Default | Description |
|---|---|---|---|
x |
int |
Required | Zero-based column index. |
y |
int |
Required | Zero-based row index. |
value |
float | None |
Required | Numeric cell value (None renders an empty cell). |
label |
str |
"" |
Custom text label overriding the formatted numeric value. |
style |
Style | None |
None |
Optional custom Style overriding color-scale fill and border for this cell. |
show |
bool |
True |
Toggles whether this cell is rendered. |
typeDrawDirection#
Spatial partial-rendering direction used with Row.draw_ratio (0.0 to 1.0) for progressive matrix heatmap animations.
DrawDirection = Literal["bottom_to_top", "left_to_right"]
| Literal Value | HeatmapChart Row Behavior |
|---|---|
"left_to_right" |
Reveals cells sequentially left-to-right across columns, smoothly interpolating the frontier cell width (default). |
"bottom_to_top" |
Grows all cells in the row vertically upward from their bottom edge (cell_height * draw_ratio). |
typeFormatterType#
Union type controlling numeric formatting for matrix cell values (value_format), hotspot annotations, and colorbar ticks.
FormatterType = str | Callable[[float], str] | None
str: Python format string (e.g."{:.1f}%","{:.2f}").Callable[[float], str]: Custom formatter callable mapping afloatto astr.None: Automatic compact numeric formatting.
classHeatmapChart#
Configurable 2D matrix/grid heatmap builder interpolating cell fill colors across Style-defined multi-stop palettes (styles=[Style, ...] or min_style + max_style).
- Coordinate Anchor: Bottom-Left
(x0, y0)by default indraw(xy=..., align="bottom_left"), or geometric center whenalign="center". - Palette Requirement: Provide either
styles($\ge 2$Stylestops from cool to hot) or bothmin_styleandmax_style.
class HeatmapChart:
    def __init__(
        self,
        *,
        styles: list[Style] | None = None,
        min_style: Style | None = None,
        max_style: Style | None = None,
        x_categories: list[str] | None = None,
        y_categories: list[str] | None = None,
        axis_line_style: Style | None = None,
        width: float = 80.0,
        height: float = 55.0,
        min_value: float | None = None,
        max_value: float | None = None,
        cell_gap: float = 0.6,
        cell_r: float = 0.4,
        cell_line_style: Style | None = None,
        value_format: FormatterType = None,
        auto_contrast_text: bool = True,
        x_label_position: Literal["bottom", "top"] = "bottom",
        y_origin: Literal["top", "bottom"] = "top",
        axis_text_style: Style | None = None,
        value_text_style: Style | None = None,
        background_style: Style | None = None,
        title: str = "",
        title_style: Style | None = None,
    ) -> None: ...
Parameters#
| Parameter | Type | Default | Description |
|---|---|---|---|
styles |
list[Style] | None |
None |
Ordered list of $\ge 2$ Style color stops from min_value to max_value. |
min_style |
Style | None |
None |
Minimum color stop Style when styles is omitted (requires max_style). |
max_style |
Style | None |
None |
Maximum color stop Style when styles is omitted (requires min_style). |
x_categories |
list[str] | None |
None |
Column category labels along the horizontal X-axis. |
y_categories |
list[str] | None |
None |
Row category labels along the vertical Y-axis (auto-populated by add_row() when None). |
axis_line_style |
Style | None |
None |
Optional style for outer matrix plot frame lines. |
width |
float |
80.0 |
Total chart bounding box width in canvas units. |
height |
float |
55.0 |
Total chart bounding box height in canvas units. |
min_value |
float | None |
None |
Explicit minimum color-scale domain bound. Inferred from data when None. |
max_value |
float | None |
None |
Explicit maximum color-scale domain bound. Inferred from data when None. |
cell_gap |
float |
0.6 |
Spacing gap between adjacent matrix cells in canvas units. |
cell_r |
float |
0.4 |
Corner rounding radius for matrix cells. |
cell_line_style |
Style | None |
None |
Optional style overriding cell border strokes. |
value_format |
FormatterType |
None |
Format string or callable for in-cell numeric labels. |
auto_contrast_text |
bool |
True |
Automatically switches in-cell label color between dark and white based on cell luminance. |
x_label_position |
"bottom" | "top" |
"bottom" |
Vertical placement of X-axis column category labels. |
y_origin |
"top" | "bottom" |
"top" |
Places row 0 at the top ("top") or bottom ("bottom") of the matrix. |
axis_text_style |
Style | None |
None |
Style for row and column category labels. Omitted when None. |
value_text_style |
Style | None |
None |
Style for numeric value labels inside cells. Omitted when None. |
background_style |
Style | None |
None |
Outer chart background card style. Omitted when None. |
title |
str |
"" |
Chart title text displayed at the top of the container. |
title_style |
Style | None |
None |
Typography style required to render title. Omitted when None. |
Methods & Properties#
add_row
def add_row(
    self,
    name: str,
    values: Sequence[float | None],
    *,
    show: bool = True,
    draw_ratio: float = 1.0,
    draw_direction: DrawDirection = "left_to_right",
) -> Row
Appends a horizontal row of matrix values (None renders an empty cell) and returns the mutable Row instance.
cells *(property)*
@property
def cells(self) -> list[Cell]
Returns a list copy of registered Cell overrides.
color_stops *(property)*
@property
def color_stops(self) -> list[Color]
Returns the extracted Color stops from the configured Style palette stops.
draw
def draw(
    self,
    xy: tuple[float, float] = (0.0, 0.0),
    *,
    width: float | None = None,
    height: float | None = None,
    align: Literal["bottom_left", "center"] = "bottom_left",
    scale: float = 1.0,
) -> None
Renders the heatmap matrix onto the canvas anchored at xy (Bottom-Left (x0, y0) by default, or geometric center when align="center").
draw_colorbar
def draw_colorbar(
    self,
    xy: tuple[float, float],
    text_style: Style,
    *,
    length: float = 30.0,
    thickness: float = 2.2,
    orientation: Orientation = "horizontal",
    num_ticks: int = 5,
    value_format: FormatterType = None,
    label: str = "",
    border_style: Style | None = None,
    scale: float = 1.0,
) -> None
Renders a continuous gradient colorbar legend anchored at bottom-left xy.
draw_legend
def draw_legend(
    self,
    xy: tuple[float, float],
    text_style: Style,
    orientation: Orientation = "vertical",
    swatch_width: float = 2.4,
    swatch_height: float = 1.2,
    item_gap: float = 4.0,
    *,
    num_steps: int = 5,
    labels: Sequence[str] | None = None,
    scale: float = 1.0,
) -> None
Renders discrete stepped color swatches (num_steps or explicit labels) at xy.
get_size
def get_size(self) -> tuple[float, float]
Returns (width, height) of the heatmap chart container in canvas units.
rows *(property)*
@property
def rows(self) -> list[Row]
Returns a list copy of registered matrix Row instances.
set_cell
def set_cell(
    self,
    x: int | str,
    y: int | str,
    value: float | None,
    *,
    label: str = "",
    style: Style | None = None,
    show: bool = True,
) -> Cell
Sets or overrides a specific matrix cell by 0-based index or category name (x column, y row) and returns the Cell override.
set_data
def set_data(
    self,
    values: Sequence[Sequence[float | None]],
    *,
    x_categories: Sequence[str] | None = None,
    y_categories: Sequence[str] | None = None,
) -> HeatmapChart
Replaces all matrix rows with a 2D sequence of values and returns self for method chaining.
styles *(property)*
@property
def styles(self) -> list[Style]
Returns a list copy of Style stops defining the heatmap color scale.
classHeatmapOverlay#
Spatial thermal hotspot overlay designed to render Gaussian heat gradients (mode="smooth") or concentric isoline rings (mode="contour") directly over diagrams (e.g. ClassDiagram, ArchitectureDiagram, GeoMap) or canvas regions.
- Coordinate Anchor: Bottom-Left
(x0, y0)by default indraw(xy=..., align="bottom_left"), or geometric center whenalign="center". Passoverlay.draw(xy=(0.0, 0.0))when overlaying onto a diagram drawn at(0.0, 0.0)so spot coordinates align 1-to-1.
class HeatmapOverlay:
    def __init__(
        self,
        *,
        styles: list[Style] | None = None,
        min_style: Style | None = None,
        max_style: Style | None = None,
        width: float | None = None,
        height: float | None = None,
        mode: OverlayMode = "smooth",
        blend_mode: BlendMode = "add",
        min_value: float = 0.0,
        max_value: float = 1.0,
        default_radius: float = 15.0,
        max_alpha: float = 0.55,
        levels: int = 4,
        show_contour_lines: bool = True,
        contour_line_width: float = 1.0,
        resolution: int = 240,
        value_format: FormatterType = None,
        value_text_style: Style | None = None,
        border_style: Style | None = None,
        title: str = "",
        title_style: Style | None = None,
    ) -> None: ...
Parameters#
| Parameter | Type | Default | Description |
|---|---|---|---|
styles |
list[Style] | None |
None |
Sequence of $\ge 2$ Style color stops from min_value to max_value. |
min_style |
Style | None |
None |
Minimum color stop Style when styles is omitted (requires max_style). |
max_style |
Style | None |
None |
Maximum color stop Style when styles is omitted (requires min_style). |
width |
float | None |
None |
Optional fixed overlay width. Auto-computed from spots via get_bounds() when None. |
height |
float | None |
None |
Optional fixed overlay height. Auto-computed from spots via get_bounds() when None. |
mode |
OverlayMode |
"smooth" |
Visual rendering mode ("smooth" Gaussian gradient or "contour" vector isolines). |
blend_mode |
BlendMode |
"add" |
Hotspot accumulation mode ("add" or "max") when smooth spots overlap. |
min_value |
float |
0.0 |
Minimum intensity scale bound mapped to the coolest color stop. |
max_value |
float |
1.0 |
Maximum intensity scale bound mapped to the hottest color stop. |
default_radius |
float |
15.0 |
Default hotspot influence radius in canvas units when radius is omitted in add_spot(). |
max_alpha |
float |
0.55 |
Peak opacity (0.05 to 1.0) at hotspot centers so underlying diagrams stay legible. |
levels |
int |
4 |
Number of concentric isoline rings per spot when mode="contour". |
show_contour_lines |
bool |
True |
Whether to draw contour ring stroke outlines when mode="contour". |
contour_line_width |
float |
1.0 |
Stroke width of contour rings when mode="contour". |
resolution |
int |
240 |
Raster grid resolution along the longer axis when mode="smooth" (32 to 1024). |
value_format |
FormatterType |
None |
Optional format string or callable for spot value labels. |
value_text_style |
Style | None |
None |
Optional typography style for spot annotation labels. |
border_style |
Style | None |
None |
Optional style for drawing an outer frame around the overlay region. |
title |
str |
"" |
Optional title text displayed above the overlay region. |
title_style |
Style | None |
None |
Typography style required to render title. Omitted when None. |
Methods & Properties#
add_spot
def add_spot(
    self,
    xy: tuple[float, float] | _HasXYProtocol,
    value: float = 1.0,
    radius: float | None = None,
    *,
    label: str = "",
    label_style: Style | None = None,
    style: Style | None = None,
    show: bool = True,
    draw_ratio: float = 1.0,
) -> Spot
Adds a thermal hotspot at xy (accepting either a (x, y) tuple or any diagram node/group exposing .xy) and returns the mutable Spot instance.
color_stops *(property)*
@property
def color_stops(self) -> list[Color]
Returns the extracted Color stops from the configured Style stops.
draw
def draw(
    self,
    xy: tuple[float, float] = (0.0, 0.0),
    *,
    width: float | None = None,
    height: float | None = None,
    align: Literal["bottom_left", "center"] = "bottom_left",
    scale: float = 1.0,
) -> None
Renders the thermal heatmap overlay onto the canvas anchored at xy (Bottom-Left (x0, y0) by default, or geometric center when align="center").
draw_colorbar
def draw_colorbar(
    self,
    xy: tuple[float, float],
    text_style: Style,
    *,
    length: float = 30.0,
    thickness: float = 2.2,
    orientation: Orientation = "horizontal",
    num_ticks: int = 5,
    value_format: FormatterType = None,
    label: str = "",
    border_style: Style | None = None,
    scale: float = 1.0,
) -> None
Renders a continuous gradient colorbar legend for the thermal overlay anchored at bottom-left xy.
draw_legend
def draw_legend(
    self,
    xy: tuple[float, float],
    text_style: Style,
    orientation: Orientation = "vertical",
    swatch_width: float = 2.4,
    swatch_height: float = 1.2,
    item_gap: float = 4.0,
    *,
    num_steps: int = 4,
    labels: Sequence[str] | None = None,
    scale: float = 1.0,
) -> None
Renders discrete stepped color swatches (num_steps or explicit labels such as ["Low", "High"]) at xy.
get_bounds
def get_bounds(self) -> tuple[float, float, float, float]
Computes the local enclosing bounding box (min_x, min_y, max_x, max_y) across all registered spots.
get_size
def get_size(self) -> tuple[float, float]
Computes overall (width, height) dimensions of the overlay region from get_bounds().
spots *(property)*
@property
def spots(self) -> list[Spot]
Returns a list copy of registered thermal Spot instances.
styles *(property)*
@property
def styles(self) -> list[Style]
Returns a list copy of Style stops defining the thermal color scale.
typeOrientation#
Literal type specifying colorbar axis orientation (draw_colorbar) or stepped swatch layout direction (draw_legend).
Orientation = Literal["vertical", "horizontal"]
| Literal Value | Description |
|---|---|
"vertical" |
Renders vertical gradient colorbar or top-to-bottom legend swatches. |
"horizontal" |
Renders horizontal gradient colorbar or left-to-right legend swatches. |
typeOverlayMode#
Literal type selecting the spatial rendering style of HeatmapOverlay.
OverlayMode = Literal["smooth", "contour"]
| Literal Value | Description |
|---|---|
"smooth" |
Renders a continuous 2D Gaussian thermal gradient field (resolution grid) (default). |
"contour" |
Renders levels concentric vector isoline rings around each hotspot. |
classRow#
Mutable data model representing a horizontal row of matrix values in a HeatmapChart.
class Row:
    def __init__(
        self,
        name: str,
        values: Sequence[float | None],
        *,
        show: bool = True,
        draw_ratio: float = 1.0,
        draw_direction: DrawDirection = "left_to_right",
    ) -> None: ...
Parameters & Attributes#
| Parameter / Attribute | Type | Default | Description |
|---|---|---|---|
name |
str |
Required | Row category label displayed along the Y-axis. |
values |
Sequence[float | None] |
Required | Numerical cell values (None for empty cells) across columns. |
show |
bool |
True |
Toggles row visibility while preserving color-scale bounds and matrix grid layout. |
draw_ratio |
float |
1.0 |
Spatial rendering ratio (0.0 to 1.0) for animations. |
draw_direction |
DrawDirection |
"left_to_right" |
Partial rendering direction ("left_to_right" column sweep or "bottom_to_top" cell growth). |
classSpot#
Mutable data model representing a spatial thermal hotspot in a HeatmapOverlay.
- Coordinate Anchor: Center
(cx, cy)(xyspecifies the hotspot peak center coordinate).
class Spot:
    def __init__(
        self,
        xy: tuple[float, float],
        value: float = 1.0,
        radius: float = 15.0,
        *,
        label: str = "",
        label_style: Style | None = None,
        style: Style | None = None,
        show: bool = True,
        draw_ratio: float = 1.0,
    ) -> None: ...
Parameters & Attributes#
| Parameter / Attribute | Type | Default | Description |
|---|---|---|---|
xy |
tuple[float, float] |
Required | Center coordinate (cx, cy) of the thermal hotspot. |
value |
float |
1.0 |
Numerical intensity/temperature value mapped against [min_value, max_value]. |
radius |
float |
15.0 |
Influence radius of the hotspot in canvas units. |
label |
str |
"" |
Optional annotation text displayed at the hotspot center. |
label_style |
Style | None |
None |
Custom typography style for label (falls back to HeatmapOverlay.value_text_style). |
style |
Style | None |
None |
Optional Style overriding the hotspot's peak/contour color. |
show |
bool |
True |
Toggles hotspot visibility while preserving auto-computed overlay bounds. |
draw_ratio |
float |
1.0 |
Scales hotspot intensity and influence radius in [0.0, 1.0] for animations. |