drawlib.charts.radar
2D multivariate radar (spider web) chart builder evaluating three or more radial dimensions across polygon or circular concentric grids. Import from drawlib.charts.radar (from drawlib.charts.radar import GridShape, RadarChart, Series).
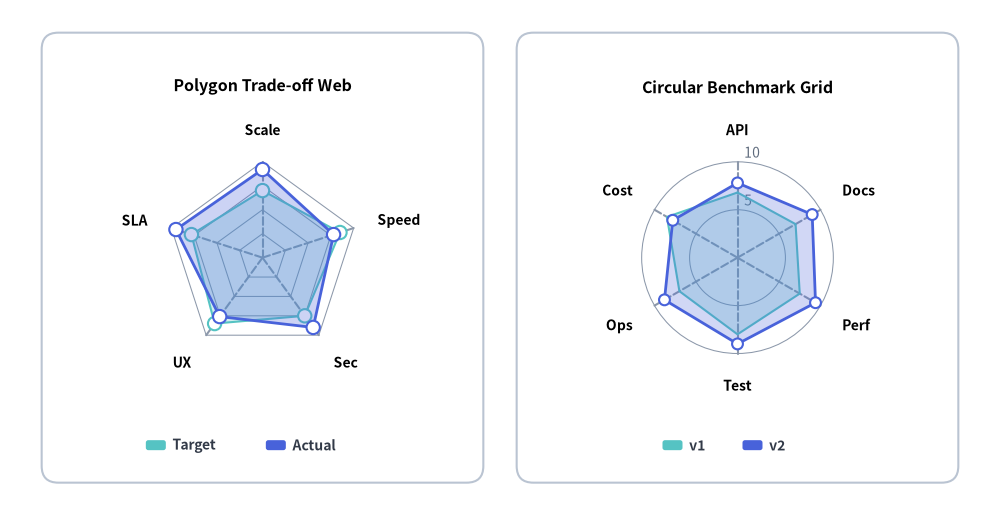
Source Code
from drawlib.canvas import save, setup
from drawlib.charts.radar import RadarChart
from drawlib.shapes import rectangle
from drawlib.styles import Colors, Styles

setup(width=120, height=62)

card_style = Styles.Neutral.patch(shape_r=2.0, shape_line_color=Colors.Gray4, shape_fill_color=Colors.White)
rectangle((31.5, 31.0), width=53.0, height=54.0, style=card_style)
rectangle((88.5, 31.0), width=53.0, height=54.0, style=card_style)

# Left: Polygon Grid RadarChart
poly = RadarChart(
    categories=["Scale", "Speed", "Sec", "UX", "SLA"],
    axis_line_style=Styles.MutedDashed,
    axis_text_style=Styles.BlackBold.patch(text_size=10.0),
    grid_style=Styles.MutedThin,
    radius=11.5,
    width=48.0,
    height=40.0,
    min_value=0.0,
    max_value=100.0,
    levels=4,
    grid_shape="polygon",
    title="Polygon Trade-off Web",
    title_style=Styles.BlackBold.patch(text_size=11.5),
)
poly.add_series("Target", [70.0, 85.0, 75.0, 85.0, 78.0], style=Styles.SecondaryNeutral, fill_alpha=0.25, line_style="dashed")
poly.add_series("Actual", [92.0, 78.0, 90.0, 76.0, 95.0], style=Styles.PrimaryFlat, fill_alpha=0.28)
poly.draw(xy=(7.5, 14.0))
poly.draw_legend(xy=(17.5, 8.5), text_style=Styles.DarkBold.patch(text_size=10.0), orientation="horizontal")

# Right: Circular Grid RadarChart
circ = RadarChart(
    categories=["API", "Docs", "Perf", "Test", "Ops", "Cost"],
    axis_line_style=Styles.MutedDashed,
    axis_text_style=Styles.BlackBold.patch(text_size=10.0),
    grid_style=Styles.MutedThin,
    scale_text_style=Styles.Muted.patch(text_size=10.0),
    radius=11.5,
    width=48.0,
    height=40.0,
    levels=2,
    grid_shape="circle",
    title="Circular Benchmark Grid",
    title_style=Styles.BlackBold.patch(text_size=11.5),
)
circ.configure_axis(min_value=0.0, max_value=10.0, levels=2, scale_format="{:.0f}")
circ.add_series("v1", [6.8, 7.0, 7.5, 8.0, 7.0, 8.5], style=Styles.SecondaryNeutral, line_style="dashed", point_shape="none")
circ.add_series("v2", [7.8, 9.0, 9.4, 9.0, 8.8, 7.8], style=Styles.PrimaryFlat, point_size=0.65)
circ.draw(xy=(64.5, 14.0))
circ.draw_legend(xy=(79.5, 8.5), text_style=Styles.DarkBold.patch(text_size=10.0), orientation="horizontal")

save()
typeDrawDirection#
Spatial partial-rendering direction used with Series.draw_ratio (0.0 to 1.0) for progressive radar polygon animations.
DrawDirection = Literal["bottom_to_top", "left_to_right"]
| Literal Value | RadarChart Behavior |
|---|---|
"bottom_to_top" |
Expands all spoke vertices radially outward simultaneously from min_value at the center origin (default). |
"left_to_right" |
Sweeps the closed polygon spoke-by-spoke around the perimeter from spoke 0 to N - 1. |
typeFormatterType#
Union type controlling numeric formatting for concentric scale rings (scale_format) and series vertex labels (value_format).
FormatterType = str | Callable[[float], str] | None
str: Python format string (e.g."{:.0f}","{:.1f}").Callable[[float], str]: Custom formatter callable mapping a numericfloatto a display string.None: Automatic compact numeric formatting.
typeGridShape#
Literal type specifying the geometry of concentric scale rings (RadarChart.grid_shape).
GridShape = Literal["polygon", "circle"]
| Literal Value | Description |
|---|---|
"polygon" |
Connects spoke tick marks with straight polygonal web segments (default). |
"circle" |
Renders smooth concentric circular rings across radial spokes. |
typeLegendPosition#
Literal type representing preset legend placement identifiers.
LegendPosition = Literal["top", "bottom", "right", "none", "auto"]
- Note:
RadarChartplaces legends explicitly on the canvas viaRadarChart.draw_legend().
classRadarChart#
2D radar (spider web) chart builder evaluating multivariate entities across three or more symmetric radial spokes emanating from a central origin.
- Coordinate Anchor: Bottom-Left
(x0, y0)by default indraw(xy=..., align="bottom_left"), or geometric center whenalign="center". - Minimum Spokes: Requires
len(categories) >= 3to form a closed radial polygon (passing fewer raises aValueError).
class RadarChart:
    def __init__(
        self,
        *,
        categories: list[str],
        axis_line_style: Style,
        radius: float = 25.0,
        min_value: float = 0.0,
        max_value: float | None = None,
        levels: int = 5,
        grid_shape: GridShape = "polygon",
        axis_text_style: Style | None = None,
        grid_style: Style | None = None,
        scale_text_style: Style | None = None,
        scale_format: FormatterType = None,
        value_text_style: Style | None = None,
        value_format: FormatterType = None,
        background_style: Style | None = None,
        title: str = "",
        title_style: Style | None = None,
        width: float | None = None,
        height: float | None = None,
    ) -> None: ...
Parameters#
| Parameter | Type | Default | Description |
|---|---|---|---|
categories |
list[str] |
Required | Names of radial dimensions around the perimeter (minimum 3 required). |
axis_line_style |
Style |
Required | Mandatory style for the radial spoke axis lines. |
radius |
float |
25.0 |
Outer radius of the radar web in canvas units. |
min_value |
float |
0.0 |
Baseline data value mapped to the central origin point. |
max_value |
float | None |
None |
Outer ring scale value. Auto-computed from series values when None. |
levels |
int |
5 |
Number of concentric grid contours (minimum 1). |
grid_shape |
GridShape |
"polygon" |
Concentric gridline geometry ("polygon" or "circle"). |
axis_text_style |
Style | None |
None |
Style for outer perimeter dimension category labels. Omitted when None. |
grid_style |
Style | None |
None |
Style for concentric grid contours. Omitted when None. |
scale_text_style |
Style | None |
None |
Style for numeric scale labels along the top vertical spoke. Omitted when None. |
scale_format |
FormatterType |
None |
Format string or callable for concentric ring scale values. |
value_text_style |
Style | None |
None |
Style for numeric values drawn next to series vertices. Omitted when None. |
value_format |
FormatterType |
None |
Format string or callable for series vertex values. |
background_style |
Style | None |
None |
Outer chart background card style. Omitted when None. |
title |
str |
"" |
Chart title text displayed at the top of the container. |
title_style |
Style | None |
None |
Typography style required to render title. Omitted when None. |
width |
float | None |
None |
Explicit container width override. Computed from radius and title when None. |
height |
float | None |
None |
Explicit container height override. Computed from radius and title when None. |
Methods & Properties#
add_series
def add_series(
    self,
    name: str,
    values: list[float],
    style: Style,
    fill_alpha: float = 0.25,
    line_width: float = 2.0,
    line_style: LineStyle = "solid",
    point_shape: PointShape = "circle",
    point_size: float = 0.8,
    legend_text_style: Style | None = None,
    *,
    show: bool = True,
    draw_ratio: float = 1.0,
    draw_direction: DrawDirection = "bottom_to_top",
) -> Series
Adds a closed radar polygon series and returns the mutable Series instance (values length must match len(categories); pass point_shape="none" to hide vertex markers).
categories *(property)*
@property
def categories(self) -> list[str]
Returns a list copy of the radial dimension labels.
configure_axis
def configure_axis(
    self,
    *,
    min_value: float | None = None,
    max_value: float | None = None,
    levels: int | None = None,
    scale_format: FormatterType = None,
) -> RadarChart
Updates radial scale bounds, concentric contour ring count, and scale label formatting in place, returning self for method chaining.
draw
def draw(
    self,
    xy: tuple[float, float] = (0.0, 0.0),
    *,
    radius: float | None = None,
    width: float | None = None,
    height: float | None = None,
    align: Literal["bottom_left", "center"] = "bottom_left",
    scale: float = 1.0,
) -> None
Renders the radar chart onto the canvas anchored at xy (Bottom-Left (x0, y0) by default, or geometric center when align="center"), with optional one-call radius, width, height, and scale overrides.
draw_legend
def draw_legend(
    self,
    xy: tuple[float, float],
    text_style: Style,
    orientation: Literal["vertical", "horizontal"] = "vertical",
    swatch_width: float = 2.4,
    swatch_height: float = 1.2,
    item_gap: float = 4.0,
    *,
    scale: float = 1.0,
) -> None
Renders a standalone series legend at xy ("vertical" or "horizontal").
get_size
def get_size(self) -> tuple[float, float]
Computes and returns the total (width, height) bounding box dimensions of the radial chart container.
series *(property)*
@property
def series(self) -> list[Series]
Returns a list copy of registered Series instances.
classSeries#
Mutable data model representing a closed radar polygon series in a RadarChart.
class Series:
    def __init__(
        self,
        name: str,
        values: list[float],
        style: Style,
        fill_alpha: float = 0.25,
        line_width: float = 2.0,
        line_style: LineStyle = "solid",
        point_shape: PointShape = "circle",
        point_size: float = 0.8,
        legend_text_style: Style | None = None,
        show: bool = True,
        draw_ratio: float = 1.0,
        draw_direction: DrawDirection = "bottom_to_top",
    ) -> None: ...
Parameters & Attributes#
| Parameter / Attribute | Type | Default | Description |
|---|---|---|---|
name |
str |
Required | Series display name shown in draw_legend(). |
values |
list[float] |
Required | Numeric values aligned with RadarChart.categories. |
style |
Style |
Required | Polygon fill, perimeter stroke, and vertex marker Style. |
fill_alpha |
float |
0.25 |
Opacity (0.0 to 1.0) of the interior polygon fill. |
line_width |
float |
2.0 |
Perimeter stroke width. |
line_style |
"solid" | "dashed" | "dotted" | "dashdot" |
"solid" |
Perimeter stroke dash pattern. |
point_shape |
"circle" | "square" | "rhombus" | "triangle" | "none" |
"circle" |
Marker geometry drawn at each spoke vertex ("none" hides markers). |
point_size |
float |
0.8 |
Vertex marker radius in canvas units. |
legend_text_style |
Style | None |
None |
Optional custom text style for this series in draw_legend(). |
show |
bool |
True |
Toggles polygon visibility while preserving automatic max_value scaling. |
draw_ratio |
float |
1.0 |
Spatial rendering progress (0.0 to 1.0) for animations. |
draw_direction |
DrawDirection |
"bottom_to_top" |
Partial rendering direction ("bottom_to_top" radial expansion or "left_to_right" spoke sweep). |