drawlib.charts.radar(レーダーチャート)
3 軸以上の放射状次元を多角形(polygon)または同心円(circle)グリッド上で多変量比較する 2D レーダーチャート(スパイダーウェブ)ビルダーです。drawlib.charts.radar からインポートします(from drawlib.charts.radar import GridShape, RadarChart, Series)。
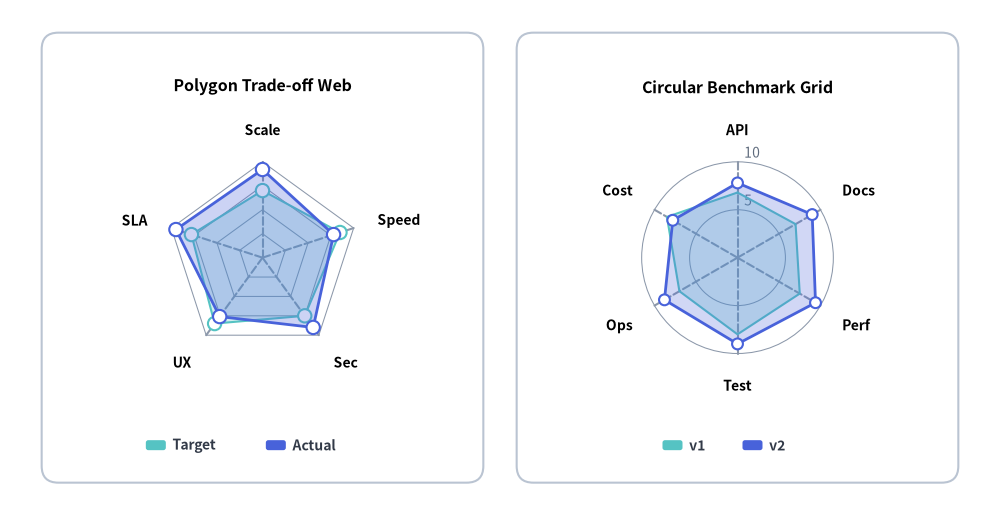
Source Code
from drawlib.canvas import save, setup
from drawlib.charts.radar import RadarChart
from drawlib.shapes import rectangle
from drawlib.styles import Colors, Styles

setup(width=120, height=62)

card_style = Styles.Neutral.patch(shape_r=2.0, shape_line_color=Colors.Gray4, shape_fill_color=Colors.White)
rectangle((31.5, 31.0), width=53.0, height=54.0, style=card_style)
rectangle((88.5, 31.0), width=53.0, height=54.0, style=card_style)

# Left: Polygon Grid RadarChart
poly = RadarChart(
    categories=["Scale", "Speed", "Sec", "UX", "SLA"],
    axis_line_style=Styles.MutedDashed,
    axis_text_style=Styles.BlackBold.patch(text_size=10.0),
    grid_style=Styles.MutedThin,
    radius=11.5,
    width=48.0,
    height=40.0,
    min_value=0.0,
    max_value=100.0,
    levels=4,
    grid_shape="polygon",
    title="Polygon Trade-off Web",
    title_style=Styles.BlackBold.patch(text_size=11.5),
)
poly.add_series("Target", [70.0, 85.0, 75.0, 85.0, 78.0], style=Styles.SecondaryNeutral, fill_alpha=0.25, line_style="dashed")
poly.add_series("Actual", [92.0, 78.0, 90.0, 76.0, 95.0], style=Styles.PrimaryFlat, fill_alpha=0.28)
poly.draw(xy=(7.5, 14.0))
poly.draw_legend(xy=(17.5, 8.5), text_style=Styles.DarkBold.patch(text_size=10.0), orientation="horizontal")

# Right: Circular Grid RadarChart
circ = RadarChart(
    categories=["API", "Docs", "Perf", "Test", "Ops", "Cost"],
    axis_line_style=Styles.MutedDashed,
    axis_text_style=Styles.BlackBold.patch(text_size=10.0),
    grid_style=Styles.MutedThin,
    scale_text_style=Styles.Muted.patch(text_size=10.0),
    radius=11.5,
    width=48.0,
    height=40.0,
    levels=2,
    grid_shape="circle",
    title="Circular Benchmark Grid",
    title_style=Styles.BlackBold.patch(text_size=11.5),
)
circ.configure_axis(min_value=0.0, max_value=10.0, levels=2, scale_format="{:.0f}")
circ.add_series("v1", [6.8, 7.0, 7.5, 8.0, 7.0, 8.5], style=Styles.SecondaryNeutral, line_style="dashed", point_shape="none")
circ.add_series("v2", [7.8, 9.0, 9.4, 9.0, 8.8, 7.8], style=Styles.PrimaryFlat, point_size=0.65)
circ.draw(xy=(64.5, 14.0))
circ.draw_legend(xy=(79.5, 8.5), text_style=Styles.DarkBold.patch(text_size=10.0), orientation="horizontal")

save()
typeDrawDirection#
Series.draw_ratio(0.0〜1.0)と組み合わせてレーダーポリゴンの部分描画方向を指定するリテラル型です。
DrawDirection = Literal["bottom_to_top", "left_to_right"]
| リテラル値 | RadarChart での動作 |
|---|---|
"bottom_to_top" |
中央原点(min_value)から各スポークの目標値に向かって全頂点を放射状に同時拡大します(デフォルト)。 |
"left_to_right" |
スポーク 0 から N - 1 へ外周に沿って順番にポリゴンを展開します。 |
typeFormatterType#
同心グリッドの目盛り値(scale_format)および系列頂点の数値ラベル(value_format)のフォーマットを指定するユニオン型です。
FormatterType = str | Callable[[float], str] | None
str: Python フォーマット文字列(例:"{:.0f}","{:.1f}")。Callable[[float], str]:floatを受け取り表示文字列を返すカスタム関数。None: コンパクトな自動数値フォーマット。
typeGridShape#
同心グリッド線の幾何形状(RadarChart.grid_shape)を指定するリテラル型です。
GridShape = Literal["polygon", "circle"]
| リテラル値 | 説明 |
|---|---|
"polygon" |
各スポークの等位点を直線で結ぶ多角形ウェブグリッド(デフォルト)。 |
"circle" |
滑らかな同心円リンググリッド。 |
typeLegendPosition#
凡例配置プリセット識別子を表すリテラル型です。
LegendPosition = Literal["top", "bottom", "right", "none", "auto"]
- 補足:
RadarChartではRadarChart.draw_legend()によりキャンバス上の任意座標へ凡例を描画します。
classRadarChart#
中心原点から対称に伸びる 3 本以上の放射軸上で多変量プロファイルを評価・比較する 2D レーダーチャートビルダーです。
- 座標アンカー:
draw(xy=..., align="bottom_left")のデフォルトは左下(x0, y0)(align="center"指定時は中心)。 - 最小軸数: 閉じた多角形を構成するため
len(categories) >= 3が必須です(3 未満の場合はValueErrorが送出されます)。
class RadarChart:
    def __init__(
        self,
        *,
        categories: list[str],
        axis_line_style: Style,
        radius: float = 25.0,
        min_value: float = 0.0,
        max_value: float | None = None,
        levels: int = 5,
        grid_shape: GridShape = "polygon",
        axis_text_style: Style | None = None,
        grid_style: Style | None = None,
        scale_text_style: Style | None = None,
        scale_format: FormatterType = None,
        value_text_style: Style | None = None,
        value_format: FormatterType = None,
        background_style: Style | None = None,
        title: str = "",
        title_style: Style | None = None,
        width: float | None = None,
        height: float | None = None,
    ) -> None: ...
パラメータ#
| パラメータ | 型 | デフォルト | 説明 |
|---|---|---|---|
categories |
list[str] |
必須 | 外周に配置する放射軸の項目名リスト(最低 3 要素必須)。 |
axis_line_style |
Style |
必須 | 放射スポーク軸線の必須スタイル。 |
radius |
float |
25.0 |
キャンバス単位でのレーダーウェブ外周半径。 |
min_value |
float |
0.0 |
中央原点に対応する最小スケール値。 |
max_value |
float | None |
None |
最外周リングのスケール値。None の場合は系列データから自動算出。 |
levels |
int |
5 |
同心グリッドリングの段数(最小 1)。 |
grid_shape |
GridShape |
"polygon" |
同心グリッド線の形状("polygon" または "circle")。 |
axis_text_style |
Style | None |
None |
外周の次元カテゴリラベルの文字スタイル。None の場合は非表示。 |
grid_style |
Style | None |
None |
同心グリッド線のスタイル。None の場合は非表示。 |
scale_text_style |
Style | None |
None |
上部垂直スポークに沿った数値目盛りラベルの文字スタイル。None の場合は非表示。 |
scale_format |
FormatterType |
None |
同心グリッド目盛り値のフォーマット文字列または関数。 |
value_text_style |
Style | None |
None |
各系列の頂点横に描画する数値ラベルの文字スタイル。None の場合は非表示。 |
value_format |
FormatterType |
None |
系列頂点の数値ラベル用フォーマット文字列または関数。 |
background_style |
Style | None |
None |
チャート外枠カードのスタイル。None の場合は非表示。 |
title |
str |
"" |
コンテナ上部に表示するチャートタイトル文字列。 |
title_style |
Style | None |
None |
title を描画するための文字スタイル。None の場合は非表示。 |
width |
float | None |
None |
コンテナ幅の明示的な上書き指定。None の場合は radius と title から自動算出。 |
height |
float | None |
None |
コンテナ高さの明示的な上書き指定。None の場合は radius と title から自動算出。 |
メソッド・プロパティ#
add_series
def add_series(
    self,
    name: str,
    values: list[float],
    style: Style,
    fill_alpha: float = 0.25,
    line_width: float = 2.0,
    line_style: LineStyle = "solid",
    point_shape: PointShape = "circle",
    point_size: float = 0.8,
    legend_text_style: Style | None = None,
    *,
    show: bool = True,
    draw_ratio: float = 1.0,
    draw_direction: DrawDirection = "bottom_to_top",
) -> Series
閉じたレーダー多角形系列を追加し、変更可能な Series インスタンスを返します(values の要素数は len(categories) と一致させる必要があります。頂点マーカーを非表示にするには point_shape="none" を渡します)。
categories *(property)*
@property
def categories(self) -> list[str]
放射軸カテゴリ名のリストコピーを返します。
configure_axis
def configure_axis(
    self,
    *,
    min_value: float | None = None,
    max_value: float | None = None,
    levels: int | None = None,
    scale_format: FormatterType = None,
) -> RadarChart
放射スケールの最小/最大値、同心グリッド段数 levels、および目盛り書式 scale_format をインプレース更新し、メソッドチェーン用に self を返します。
draw
def draw(
    self,
    xy: tuple[float, float] = (0.0, 0.0),
    *,
    radius: float | None = None,
    width: float | None = None,
    height: float | None = None,
    align: Literal["bottom_left", "center"] = "bottom_left",
    scale: float = 1.0,
) -> None
基準座標 xy(デフォルトは左下 (x0, y0)、align="center" で中心)にレーダーチャートを描画します。一時的な radius・width・height・scale 上書きに対応します。
draw_legend
def draw_legend(
    self,
    xy: tuple[float, float],
    text_style: Style,
    orientation: Literal["vertical", "horizontal"] = "vertical",
    swatch_width: float = 2.4,
    swatch_height: float = 1.2,
    item_gap: float = 4.0,
    *,
    scale: float = 1.0,
) -> None
座標 xy に独立した系列凡例を描画します("vertical" または "horizontal")。
get_size
def get_size(self) -> tuple[float, float]
チャートコンテナ全体の (width, height) 寸法を算出して返します。
series *(property)*
@property
def series(self) -> list[Series]
登録済みの Series インスタンスのリストコピーを返します。
classSeries#
RadarChart 内の閉じた多角形データ系列を表す変更可能なデータモデルです。
class Series:
    def __init__(
        self,
        name: str,
        values: list[float],
        style: Style,
        fill_alpha: float = 0.25,
        line_width: float = 2.0,
        line_style: LineStyle = "solid",
        point_shape: PointShape = "circle",
        point_size: float = 0.8,
        legend_text_style: Style | None = None,
        show: bool = True,
        draw_ratio: float = 1.0,
        draw_direction: DrawDirection = "bottom_to_top",
    ) -> None: ...
パラメータ・属性#
| パラメータ/属性 | 型 | デフォルト | 説明 |
|---|---|---|---|
name |
str |
必須 | draw_legend() に表示される系列名。 |
values |
list[float] |
必須 | RadarChart.categories に対応する数値リスト。 |
style |
Style |
必須 | 多角形の塗り・外周ストローク・頂点マーカーの Style。 |
fill_alpha |
float |
0.25 |
内部ポリゴン塗りの不透明度(0.0〜1.0)。 |
line_width |
float |
2.0 |
外周ストロークの線幅。 |
line_style |
"solid" | "dashed" | "dotted" | "dashdot" |
"solid" |
外周ストロークの線種パターン。 |
point_shape |
"circle" | "square" | "rhombus" | "triangle" | "none" |
"circle" |
各スポーク頂点のマーカー形状("none" で非表示)。 |
point_size |
float |
0.8 |
キャンバス単位での頂点マーカー半径。 |
legend_text_style |
Style | None |
None |
draw_legend() におけるこの系列専用の文字スタイル上書き指定。 |
show |
bool |
True |
自動 max_value スケーリングを維持したまま表示/非表示を切り替えます。 |
draw_ratio |
float |
1.0 |
アニメーション用の部分描画比率(0.0〜1.0)。 |
draw_direction |
DrawDirection |
"bottom_to_top" |
部分描画方向("bottom_to_top" 放射拡大/"left_to_right" スポーク順展開)。 |