drawlib.charts.scatter(散布図・バブルチャート)
独立した線形/対数の連続数値 XY 軸上に (x, y) 散布点および (x, y, radius) 多次元バブルデータをプロットする 2D 散布図・バブルチャートビルダーです。drawlib.charts.scatter からインポートします(from drawlib.charts.scatter import Axis, Point, ScatterChart, Series)。
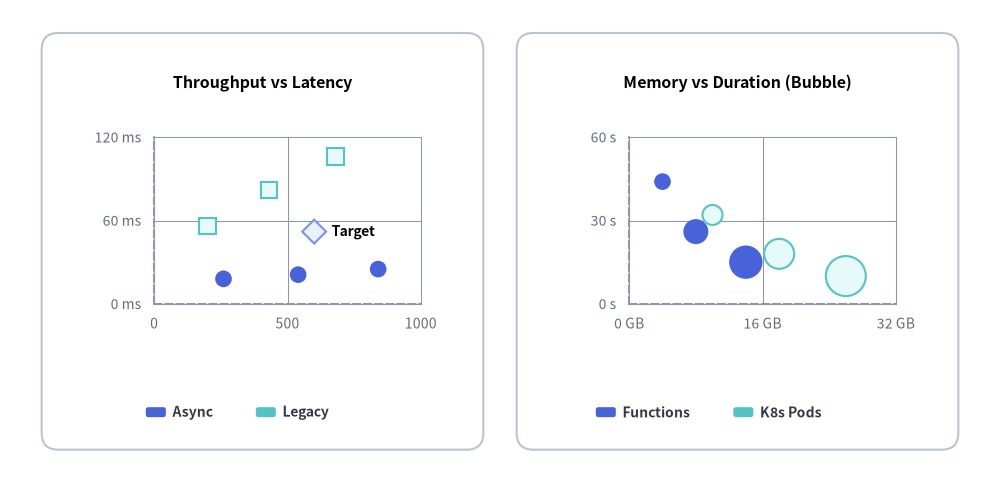
Source Code
from drawlib.canvas import save, setup
from drawlib.charts.scatter import ScatterChart
from drawlib.shapes import rectangle
from drawlib.styles import Colors, Styles

setup(width=120, height=58)

card_style = Styles.Neutral.patch(shape_r=2.0, shape_line_color=Colors.Gray4, shape_fill_color=Colors.White)
rectangle((31.5, 29.0), width=53.0, height=50.0, style=card_style)
rectangle((88.5, 29.0), width=53.0, height=50.0, style=card_style)

# Left: Benchmark Scatter with Annotated Point & Series
sc = ScatterChart(
    axis_line_style=Styles.MutedDashed,
    axis_text_style=Styles.Muted.patch(text_size=10.0),
    value_text_style=Styles.BlackBold.patch(text_size=10.0),
    grid_style=Styles.MutedThin,
    width=48.0,
    height=37.0,
    title="Throughput vs Latency",
    title_style=Styles.BlackBold.patch(text_size=11.5),
)
sc.configure_x_axis(min_value=0.0, max_value=1000.0, tick_step=500.0)
sc.configure_y_axis(min_value=0.0, max_value=120.0, tick_step=60.0, unit="ms")
sc.add(xy=(600.0, 52.0), style=Styles.PrimaryNeutral, radius=1.3, shape="rhombus", label="Target")
sc.add_series("Async", [(260.0, 18.0), (540.0, 21.0), (840.0, 25.0)], style=Styles.PrimaryFlat, radius=1.0, shape="circle")
sc.add_series("Legacy", [(200.0, 56.0), (430.0, 82.0), (680.0, 106.0)], style=Styles.SecondaryNeutral, radius=1.0, shape="square")
sc.draw(xy=(7.5, 13.5))
sc.draw_legend(xy=(17.5, 8.5), text_style=Styles.DarkBold.patch(text_size=10.0), orientation="horizontal")

# Right: Multidimensional Bubble Chart (x, y, radius)
bub = ScatterChart(
    axis_line_style=Styles.MutedDashed,
    axis_text_style=Styles.Muted.patch(text_size=10.0),
    grid_style=Styles.MutedThin,
    width=48.0,
    height=37.0,
    title="Memory vs Duration (Bubble)",
    title_style=Styles.BlackBold.patch(text_size=11.5),
)
bub.configure_x_axis(min_value=0.0, max_value=32.0, tick_step=16.0, unit="GB")
bub.configure_y_axis(min_value=0.0, max_value=60.0, tick_step=30.0, unit="s")
bub.add_series("Functions", [(4.0, 44.0, 1.0), (8.0, 26.0, 1.5), (14.0, 15.0, 2.0)], style=Styles.PrimaryFlat, shape="circle")
bub.add_series("K8s Pods", [(10.0, 32.0, 1.2), (18.0, 18.0, 1.8), (26.0, 10.0, 2.4)], style=Styles.SecondaryNeutral, shape="circle")
bub.draw(xy=(64.5, 13.5))
bub.draw_legend(xy=(71.5, 8.5), text_style=Styles.DarkBold.patch(text_size=10.0), orientation="horizontal", item_gap=2.5)

save()
classAxis#
ScatterChart の連続数値座標軸(x_axis または y_axis)を表し、線形/対数スケーリング、値域、目盛り、グリッド線、書式設定を制御します。
class Axis:
    def __init__(
        self,
        scale: ScaleType = "linear",
        min_value: float | None = None,
        max_value: float | None = None,
        ticks: list[float] | None = None,
        tick_step: float | None = None,
        format: FormatterType = None,
        unit: str = "",
        label: str = "",
        show_grid: bool = True,
        grid_style: Style | None = None,
        show_axis_line: bool = True,
        line_style: Style | None = None,
        show_ticks: bool = True,
        tick_label_style: Style | None = None,
        label_style: Style | None = None,
    ) -> None: ...
パラメータ#
| パラメータ | 型 | デフォルト | 説明 |
|---|---|---|---|
scale |
ScaleType |
"linear" |
線形スケール("linear")または常用対数スケール("log")。 |
min_value |
float | None |
None |
軸の最小値。None の場合は自動算出されます。 |
max_value |
float | None |
None |
軸の最大値。None の場合は自動算出されます。 |
ticks |
list[float] | None |
None |
自動目盛り生成を上書きする明示的な目盛り値リスト。 |
tick_step |
float | None |
None |
線形スケールにおける隣接目盛り間のステップ間隔。 |
format |
str | Callable[[float], str] | None |
None |
軸目盛りラベル用のフォーマット文字列または関数。 |
unit |
str |
"" |
フォーマット済み目盛りラベルの末尾に付与する単位(例: "ms", "GB", " rps")。 |
label |
str |
"" |
軸タイトル文字列。 |
show_grid |
bool |
True |
チャートの grid_style 指定時にグリッド線を描画するか。 |
grid_style |
Style | None |
None |
この軸専用のグリッド線 Style 上書き指定。 |
show_axis_line |
bool |
True |
軸のベースライン線を描画するか。 |
line_style |
Style | None |
None |
この軸専用のベースライン Style 上書き指定。 |
show_ticks |
bool |
True |
目盛りラベルを描画するか。 |
tick_label_style |
Style | None |
None |
目盛りラベル専用の Style 上書き指定。 |
label_style |
Style | None |
None |
軸タイトル label 用の Style 上書き指定。 |
メソッド#
configure
def configure(
    self,
    scale: ScaleType | None = None,
    min_value: float | None = None,
    max_value: float | None = None,
    ticks: list[float] | None = None,
    tick_step: float | None = None,
    format: FormatterType = None,
    unit: str | None = None,
    label: str | None = None,
    show_grid: bool | None = None,
    grid_style: Style | None = None,
    show_axis_line: bool | None = None,
    line_style: Style | None = None,
    show_ticks: bool | None = None,
    tick_label_style: Style | None = None,
    label_style: Style | None = None,
) -> None
複数の軸設定オプションをインプレースで一括更新します。
format_value
def format_value(self, value: float) -> str
数値 value を format と unit に従って表示用文字列へ変換します。
typeDrawDirection#
Series.draw_ratio(0.0〜1.0)と組み合わせて散布図・バブルチャートの部分描画方向を指定するリテラル型です。
DrawDirection = Literal["bottom_to_top", "left_to_right"]
| リテラル値 | ScatterChart での動作 |
|---|---|
"left_to_right" |
X 軸の値域に沿って左から右へ順番にデータ点を出現させます(デフォルト)。 |
"bottom_to_top" |
下端ベースラインから目標の y 値へ上昇させつつ、半径を radius * draw_ratio で拡大します。 |
typeLegendPosition#
凡例配置プリセット識別子を表すリテラル型です。
LegendPosition = Literal["top", "bottom", "right", "none", "auto"]
- 補足:
ScatterChartではScatterChart.draw_legend()により明示座標へ凡例を描画します。
classPoint#
ScatterChart 内の単一 (x, y) データ点を表す変更可能なデータモデルです(ScatterChart.add() による単独点、または Series の要素として使用)。
- データ座標:
xyにはキャンバス座標ではなくx_axis・y_axis上のデータ値(x, y)を指定します。
class Point:
    def __init__(
        self,
        xy: tuple[float, float],
        style: Style,
        radius: float = 1.0,
        shape: PointShape = "circle",
        label: str = "",
        label_style: Style | None = None,
        *,
        show: bool = True,
    ) -> None: ...
パラメータ・属性#
| パラメータ/属性 | 型 | デフォルト | 説明 |
|---|---|---|---|
xy |
tuple[float, float] |
必須 | x_axis・y_axis 上の連続データ座標 (x, y)。 |
style |
Style |
必須 | マーカーの塗りおよび枠線 Style。 |
radius |
float |
1.0 |
キャンバス単位でのマーカー半径(または半幅)。 |
shape |
PointShape |
"circle" |
マーカー形状("circle", "square", "rhombus", "triangle", "none")。 |
label |
str |
"" |
点の横に描画する注釈ラベルテキスト。 |
label_style |
Style | None |
None |
label 専用の文字スタイル(None 時は ScatterChart.value_text_style を使用)。 |
show |
bool |
True |
自動 X/Y 軸スケールを維持したまま表示/非表示を切り替えます。 |
typePointShape#
散布点およびバブルマーカーの幾何形状を指定するリテラル型です。
PointShape = Literal["circle", "square", "rhombus", "triangle", "none"]
| リテラル値 | 説明 |
|---|---|
"circle" |
円形マーカー(バブルプロットにも最適、デフォルト)。 |
"square" |
正方形マーカー。 |
"rhombus" |
45° 回転したひし形マーカー。 |
"triangle" |
上向き正三角形マーカー。 |
"none" |
マーカー図形を非表示にします(add(..., shape="none", label="...") によるテキスト注釈点に便利)。 |
typeScaleType#
Axis(configure_x_axis / configure_y_axis)の座標マッピング方式を指定するリテラル型です。
ScaleType = Literal["linear", "log"]
| リテラル値 | 説明 |
|---|---|
"linear" |
標準の算術線形スケール($1, 2, 5 \times 10^k$ 間隔で目盛りを自動生成、デフォルト)。 |
"log" |
複数桁にまたがる正のデータ領域向けの常用対数($\log_{10}$)スケール。 |
classScatterChart#
独立した連続数値 X 軸・Y 軸を持つ 2D 散布図・バブルチャートビルダーです。
- 座標アンカー:
draw(xy=..., align="bottom_left")のデフォルトは左下(x0, y0)(align="center"指定時は中心)。
class ScatterChart:
    def __init__(
        self,
        *,
        axis_line_style: Style,
        width: float = 88.0,
        height: float = 55.0,
        default_radius: float = 1.0,
        default_shape: PointShape = "circle",
        axis_text_style: Style | None = None,
        grid_style: Style | None = None,
        value_text_style: Style | None = None,
        background_style: Style | None = None,
        title: str = "",
        title_style: Style | None = None,
    ) -> None: ...
パラメータ#
| パラメータ | 型 | デフォルト | 説明 |
|---|---|---|---|
axis_line_style |
Style |
必須 | X 軸・Y 軸のベースラインおよび目盛り線の必須スタイル。 |
width |
float |
88.0 |
キャンバス単位でのチャート全体の幅。 |
height |
float |
55.0 |
キャンバス単位でのチャート全体の高さ。 |
default_radius |
float |
1.0 |
add() / add_series() で radius 省略時に使われるデフォルトマーカー半径。 |
default_shape |
PointShape |
"circle" |
add() / add_series() で shape 省略時に使われるデフォルトマーカー形状。 |
axis_text_style |
Style | None |
None |
X/Y 軸の目盛りラベルおよび軸タイトルの文字スタイル。None の場合は非表示。 |
grid_style |
Style | None |
None |
水平・垂直グリッド線のスタイル。None の場合は非表示。 |
value_text_style |
Style | None |
None |
Point.label の label_style=None 時に使われるデフォルト注釈文字スタイル。 |
background_style |
Style | None |
None |
チャート外枠カードのスタイル。None の場合は非表示。 |
title |
str |
"" |
コンテナ上部に表示するチャートタイトル文字列。 |
title_style |
Style | None |
None |
title を描画するための文字スタイル。None の場合は非表示。 |
メソッド・プロパティ#
add
def add(
    self,
    xy: tuple[float, float],
    style: Style,
    radius: float | None = None,
    shape: PointShape | None = None,
    label: str = "",
    label_style: Style | None = None,
    *,
    show: bool = True,
) -> Point
任意の注釈 label を伴う単独の (x, y) データ点を追加し、変更可能な Point インスタンスを返します(単独点は draw_legend() には含まれません)。
add_series
def add_series(
    self,
    name: str,
    data: list[tuple[float, float]] | list[tuple[float, float, float]],
    style: Style,
    radius: float | None = None,
    shape: PointShape | None = None,
    legend_text_style: Style | None = None,
    *,
    show: bool = True,
    draw_ratio: float = 1.0,
    draw_direction: DrawDirection = "left_to_right",
) -> Series
2 要素タプル (x, y) の散布点リスト、または 3 要素タプル (x, y, radius) のバブル点リストを名前付き系列として登録し、変更可能な Series インスタンスを返します。
configure_x_axis
def configure_x_axis(
    self,
    scale: ScaleType | None = None,
    min_value: float | None = None,
    max_value: float | None = None,
    ticks: list[float] | None = None,
    tick_step: float | None = None,
    format: FormatterType = None,
    unit: str | None = None,
    label: str | None = None,
    show_grid: bool | None = None,
    grid_style: Style | None = None,
    show_axis_line: bool | None = None,
    line_style: Style | None = None,
    show_ticks: bool | None = None,
    tick_label_style: Style | None = None,
) -> Axis
連続数値 X 軸のパラメータを一括設定し、x_axis を返します。
configure_y_axis
def configure_y_axis(
    self,
    scale: ScaleType | None = None,
    min_value: float | None = None,
    max_value: float | None = None,
    ticks: list[float] | None = None,
    tick_step: float | None = None,
    format: FormatterType = None,
    unit: str | None = None,
    label: str | None = None,
    show_grid: bool | None = None,
    grid_style: Style | None = None,
    show_axis_line: bool | None = None,
    line_style: Style | None = None,
    show_ticks: bool | None = None,
    tick_label_style: Style | None = None,
) -> Axis
連続数値 Y 軸のパラメータを一括設定し、y_axis を返します。
draw
def draw(
    self,
    xy: tuple[float, float] = (0.0, 0.0),
    *,
    width: float | None = None,
    height: float | None = None,
    align: Literal["bottom_left", "center"] = "bottom_left",
    scale: float = 1.0,
) -> None
基準座標 xy(デフォルトは左下 (x0, y0)、align="center" で中心)に散布図を描画します。
draw_legend
def draw_legend(
    self,
    xy: tuple[float, float],
    text_style: Style,
    orientation: Orientation = "vertical",
    swatch_width: float = 2.4,
    swatch_height: float = 1.2,
    item_gap: float = 4.0,
    *,
    scale: float = 1.0,
) -> None
座標 xy に登録済み Series の独立した凡例を描画します("vertical" または "horizontal")。
get_size
def get_size(self) -> tuple[float, float]
チャートコンテナの (width, height) をキャンバス単位で返します。
points *(property)*
@property
def points(self) -> list[Point]
add() で登録された単独 Point インスタンスのリストコピーを返します。
series *(property)*
@property
def series(self) -> list[Series]
add_series() で登録された名前付き Series インスタンスのリストコピーを返します。
classSeries#
ScatterChart 内の名前付き散布点・バブル点グループを表す変更可能なデータモデルです。
class Series:
    def __init__(
        self,
        name: str,
        points: list[Point],
        style: Style,
        radius: float = 1.0,
        shape: PointShape = "circle",
        legend_text_style: Style | None = None,
        *,
        show: bool = True,
        draw_ratio: float = 1.0,
        draw_direction: DrawDirection = "left_to_right",
    ) -> None: ...
パラメータ・属性#
| パラメータ/属性 | 型 | デフォルト | 説明 |
|---|---|---|---|
name |
str |
必須 | draw_legend() に表示される系列名。 |
points |
list[Point] |
必須 | この系列に属する Point インスタンスのリスト。 |
style |
Style |
必須 | 系列のデフォルトマーカー塗り・枠線 Style。 |
radius |
float |
1.0 |
系列レベルの基準マーカー半径(キャンバス単位)。 |
shape |
PointShape |
"circle" |
系列レベルのマーカー形状。 |
legend_text_style |
Style | None |
None |
draw_legend() におけるこの系列専用の文字スタイル上書き指定。 |
show |
bool |
True |
自動 X/Y 軸スケールを維持したまま系列の表示/非表示を切り替えます。 |
draw_ratio |
float |
1.0 |
アニメーション用の部分描画比率(0.0〜1.0)。 |
draw_direction |
DrawDirection |
"left_to_right" |
部分描画の進行方向("left_to_right" または "bottom_to_top")。 |