drawlib.charts.area(面グラフ)
半透明の重なり面グラフ(mode="overlap")および累積積み上げ面グラフ(mode="stack")、滑らかなスプライン輪郭、分離型凡例描画を備えた 2D 面グラフビルダーです。drawlib.charts.area からインポートします(from drawlib.charts.area import AreaChart, Axis, Series)。
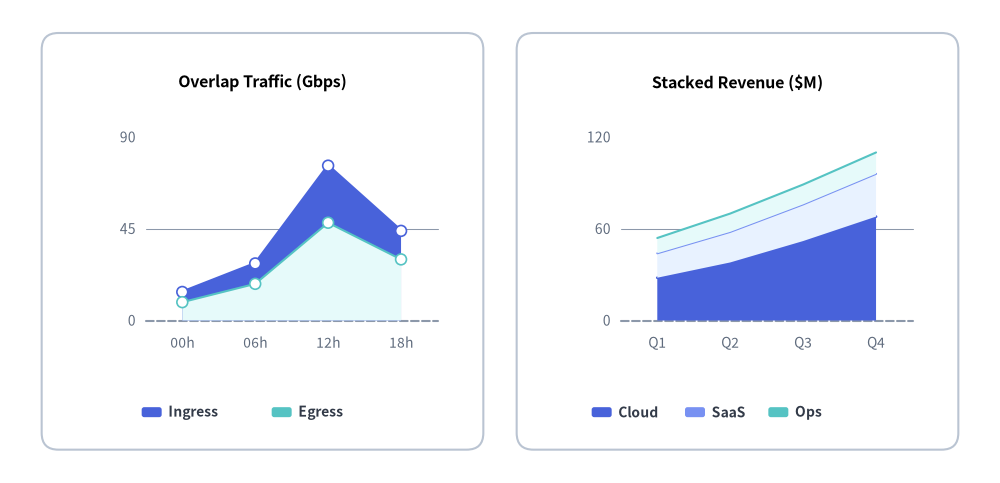
Source Code
from drawlib.canvas import save, setup
from drawlib.charts.area import AreaChart
from drawlib.shapes import rectangle
from drawlib.styles import Colors, Styles

setup(width=120, height=58)

card_style = Styles.Neutral.patch(shape_r=2.0, shape_line_color=Colors.Gray4, shape_fill_color=Colors.White)
rectangle((31.5, 29.0), width=53.0, height=50.0, style=card_style)
rectangle((88.5, 29.0), width=53.0, height=50.0, style=card_style)

# Left: Smooth Overlapping AreaChart (mode="overlap")
overlap = AreaChart(
    axis_line_style=Styles.MutedDashed,
    categories=["00h", "06h", "12h", "18h"],
    width=48.0,
    height=37.0,
    mode="overlap",
    fill_alpha=0.32,
    smooth=True,
    show_points=True,
    point_shape="circle",
    point_size=0.65,
    axis_text_style=Styles.Muted.patch(text_size=10.0),
    grid_style=Styles.MutedThin,
    title="Overlap Traffic (Gbps)",
    title_style=Styles.BlackBold.patch(text_size=11.5),
)
overlap.add_series("Ingress", [14.0, 28.0, 76.0, 44.0], style=Styles.PrimaryFlat, line_width=2.2)
overlap.add_series("Egress", [9.0, 18.0, 48.0, 30.0], style=Styles.SecondaryNeutral, line_width=2.0, line_style="dashed")
overlap.configure_y_axis(min_value=0.0, max_value=90.0, tick_step=45.0)
overlap.draw(xy=(7.5, 13.5))
overlap.draw_legend(xy=(17.0, 8.5), text_style=Styles.DarkBold.patch(text_size=10.0), orientation="horizontal")

# Right: Cumulative Stacked AreaChart (mode="stack")
stacked = AreaChart(
    axis_line_style=Styles.MutedDashed,
    categories=["Q1", "Q2", "Q3", "Q4"],
    width=48.0,
    height=37.0,
    mode="stack",
    fill_alpha=0.68,
    smooth=False,
    axis_text_style=Styles.Muted.patch(text_size=10.0),
    grid_style=Styles.MutedThin,
    title="Stacked Revenue ($M)",
    title_style=Styles.BlackBold.patch(text_size=11.5),
)
stacked.add_series("Cloud", [28.0, 38.0, 52.0, 68.0], style=Styles.PrimaryFlat)
stacked.add_series("SaaS", [16.0, 20.0, 24.0, 28.0], style=Styles.PrimaryNeutral)
stacked.add_series("Ops", [10.0, 12.0, 13.0, 14.0], style=Styles.SecondaryNeutral)
stacked.configure_y_axis(min_value=0.0, max_value=120.0, tick_step=60.0)
stacked.draw(xy=(64.5, 13.5))
stacked.draw_legend(xy=(71.0, 8.5), text_style=Styles.DarkBold.patch(text_size=10.0), orientation="horizontal", item_gap=2.0)

save()
classAreaChart#
ベースライン($Y = 0$)または下位レイヤー上に塗りつぶしポリゴンを描画し、時系列・カテゴリ別のボリューム推移や内訳構成比を可視化する 2D 面グラフビルダーです。
- 座標アンカー:
draw(xy=..., align="bottom_left")のデフォルトは左下(x0, y0)(align="center"指定時は中心)。 - 頂点数値ラベル:
value_text_styleとともにshow_points=Trueかつpoint_shape != "none"が指定された場合、y_axis.format_value(v)による数値ラベルが頂点上部に描画されます。
class AreaChart:
    def __init__(
        self,
        *,
        axis_line_style: Style,
        categories: list[str],
        width: float = 80.0,
        height: float = 50.0,
        mode: Mode = "overlap",
        fill_alpha: float = 0.35,
        show_points: bool = False,
        point_shape: PointShape = "none",
        point_size: float = 1.0,
        smooth: bool = False,
        axis_text_style: Style | None = None,
        grid_style: Style | None = None,
        value_text_style: Style | None = None,
        background_style: Style | None = None,
        title: str = "",
        title_style: Style | None = None,
    ) -> None: ...
パラメータ#
| パラメータ | 型 | デフォルト | 説明 |
|---|---|---|---|
axis_line_style |
Style |
必須 | 直交座標軸のベースラインおよび目盛り線の必須スタイル。 |
categories |
list[str] |
必須 | 水平 X 軸に沿った順序付きカテゴリ名リスト。 |
width |
float |
80.0 |
キャンバス単位でのチャート全体の幅。 |
height |
float |
50.0 |
キャンバス単位でのチャート全体の高さ。 |
mode |
Mode |
"overlap" |
面ポリゴンの合成モード("overlap" 独立重なり/"stack" 累積積み上げ)。 |
fill_alpha |
float |
0.35 |
面ポリゴンのデフォルト塗り不透明度(0.0〜1.0)。 |
show_points |
bool |
False |
上端境界ライン上の頂点にマーカーを描画するか。 |
point_shape |
PointShape |
"none" |
show_points=True 時のデフォルト頂点マーカー形状("circle", "square", "rhombus", "triangle", "none")。 |
point_size |
float |
1.0 |
キャンバス単位でのデフォルト頂点マーカー半径(または半幅)。 |
smooth |
bool |
False |
True の場合、上端輪郭線および面ポリゴンを滑らかなスプライン曲線で補間します。 |
axis_text_style |
Style | None |
None |
Y 軸目盛り値および X 軸カテゴリ名の文字スタイル。None の場合は非表示。 |
grid_style |
Style | None |
None |
水平 Y 軸グリッド線のスタイル。None の場合は非表示。 |
value_text_style |
Style | None |
None |
頂点マーカー上部に描画する数値ラベルの文字スタイル。None の場合は非表示。 |
background_style |
Style | None |
None |
チャート外枠カードのスタイル。None の場合は非表示。 |
title |
str |
"" |
コンテナ上部に表示するチャートタイトル文字列。 |
title_style |
Style | None |
None |
title を描画するための文字スタイル。None の場合は非表示。 |
メソッド・プロパティ#
add_series
def add_series(
    self,
    name: str,
    values: list[float],
    style: Style,
    fill_alpha: float | None = None,
    line_width: float = 2.0,
    line_style: LineStyle = "solid",
    point_shape: PointShape | None = None,
    point_size: float | None = None,
    legend_text_style: Style | None = None,
    *,
    show: bool = True,
    draw_ratio: float = 1.0,
    draw_direction: DrawDirection = "left_to_right",
) -> Series
面データ系列を追加し、変更可能な Series インスタンスを返します(fill_alpha 指定時はチャート全体のデフォルト不透明度を上書きします)。
configure_x_axis
def configure_x_axis(
    self,
    scale: ScaleType | None = None,
    min_value: float | None = None,
    max_value: float | None = None,
    ticks: list[float] | None = None,
    tick_step: float | None = None,
    format: FormatterType = None,
    unit: str | None = None,
    label: str | None = None,
    show_grid: bool | None = None,
    grid_style: Style | None = None,
    show_axis_line: bool | None = None,
    line_style: Style | None = None,
    show_ticks: bool | None = None,
    tick_label_style: Style | None = None,
) -> Axis
水平 X 軸のパラメータを一括設定し、x_axis を返します。
configure_y_axis
def configure_y_axis(
    self,
    scale: ScaleType | None = None,
    min_value: float | None = None,
    max_value: float | None = None,
    ticks: list[float] | None = None,
    tick_step: float | None = None,
    format: FormatterType = None,
    unit: str | None = None,
    label: str | None = None,
    show_grid: bool | None = None,
    grid_style: Style | None = None,
    show_axis_line: bool | None = None,
    line_style: Style | None = None,
    show_ticks: bool | None = None,
    tick_label_style: Style | None = None,
) -> Axis
垂直 Y 軸のスケール・値域・目盛り・書式・タイトルを一括設定し、y_axis を返します。
draw
def draw(
    self,
    xy: tuple[float, float] = (0.0, 0.0),
    *,
    width: float | None = None,
    height: float | None = None,
    align: Literal["bottom_left", "center"] = "bottom_left",
    scale: float = 1.0,
) -> None
基準座標 xy(デフォルトは左下 (x0, y0)、align="center" で中心)に面グラフを描画します。
draw_legend
def draw_legend(
    self,
    xy: tuple[float, float],
    text_style: Style,
    orientation: Orientation = "vertical",
    swatch_width: float = 2.4,
    swatch_height: float = 1.2,
    item_gap: float = 4.0,
    *,
    scale: float = 1.0,
) -> None
座標 xy に独立した系列凡例を描画します("vertical" または "horizontal")。
get_size
def get_size(self) -> tuple[float, float]
チャートコンテナの (width, height) をキャンバス単位で返します。
series *(property)*
@property
def series(self) -> list[Series]
登録済みの Series インスタンスのリストコピーを返します。
classAxis#
AreaChart の座標軸(数値軸・カテゴリ軸)を表し、スケーリング・値域・目盛り・グリッド線・書式設定を制御します。
class Axis:
    def __init__(
        self,
        scale: ScaleType = "linear",
        min_value: float | None = None,
        max_value: float | None = None,
        ticks: list[float] | None = None,
        tick_step: float | None = None,
        format: FormatterType = None,
        unit: str = "",
        label: str = "",
        show_grid: bool = True,
        grid_style: Style | None = None,
        show_axis_line: bool = True,
        line_style: Style | None = None,
        show_ticks: bool = True,
        tick_label_style: Style | None = None,
        label_style: Style | None = None,
    ) -> None: ...
パラメータ#
| パラメータ | 型 | デフォルト | 説明 |
|---|---|---|---|
scale |
"linear" | "log" |
"linear" |
線形スケールまたは常用対数(log10)スケール。 |
min_value |
float | None |
None |
軸の最小値。 |
max_value |
float | None |
None |
軸の最大値。 |
ticks |
list[float] | None |
None |
自動目盛り生成を上書きする明示的な目盛り値リスト。 |
tick_step |
float | None |
None |
線形スケールにおける目盛り間隔ステップ。 |
format |
FormatterType |
None |
目盛りおよび頂点ラベル用のフォーマット文字列または Callable[[float], str]。 |
unit |
str |
"" |
フォーマット済み目盛りラベルに付与する単位(例: "Gbps", "M$")。 |
label |
str |
"" |
軸タイトル文字列。 |
show_grid |
bool |
True |
チャートの grid_style 指定時にグリッド線を描画するか。 |
grid_style |
Style | None |
None |
この軸専用のグリッド線 Style 上書き指定。 |
show_axis_line |
bool |
True |
軸のベースライン線を描画するか。 |
line_style |
Style | None |
None |
この軸専用のベースライン Style 上書き指定。 |
show_ticks |
bool |
True |
目盛りラベルを描画するか。 |
tick_label_style |
Style | None |
None |
目盛りラベル専用の Style 上書き指定。 |
label_style |
Style | None |
None |
軸タイトル label 用の Style 上書き指定。 |
メソッド#
configure
def configure(
    self,
    scale: ScaleType | None = None,
    min_value: float | None = None,
    max_value: float | None = None,
    ticks: list[float] | None = None,
    tick_step: float | None = None,
    format: FormatterType = None,
    unit: str | None = None,
    label: str | None = None,
    show_grid: bool | None = None,
    grid_style: Style | None = None,
    show_axis_line: bool | None = None,
    line_style: Style | None = None,
    show_ticks: bool | None = None,
    tick_label_style: Style | None = None,
    label_style: Style | None = None,
) -> None
複数の軸設定オプションをインプレースで一括更新します。
format_value
def format_value(self, value: float) -> str
数値 value を format と unit に従って表示用文字列へ変換します。
typeDrawDirection#
Series.draw_ratio(0.0〜1.0)と組み合わせて面グラフの部分描画方向を指定するリテラル型です。
DrawDirection = Literal["bottom_to_top", "left_to_right"]
| リテラル値 | AreaChart での動作 |
|---|---|
"left_to_right" |
塗りつぶし面ポリゴンと上端輪郭線を左から右へ連続的にスイープ描画します(デフォルト)。 |
"bottom_to_top" |
ベースライン(または下位スタック境界)から上方向へ面ポリゴンを立ち上げます。 |
typeFormatterType#
軸目盛りおよび頂点数値ラベル(Axis.format)のフォーマットを指定するユニオン型です。
FormatterType = str | Callable[[float], str] | None
str: Python フォーマット文字列(例:"{:.1f}","${:,.0f}")。Callable[[float], str]:floatを受け取りstrを返すカスタム関数。None: コンパクトな自動数値フォーマット。
typeLegendPosition#
凡例配置プリセット識別子を表すリテラル型です。
LegendPosition = Literal["top", "bottom", "right", "none", "auto"]
- 補足:
AreaChartではAreaChart.draw_legend()により明示座標へ凡例を描画します。
typeMode#
複数系列の面ポリゴンの重ね合わせ方式(AreaChart.mode)を指定するリテラル型です。
Mode = Literal["overlap", "stack"]
| リテラル値 | 説明 |
|---|---|
"overlap" |
各系列をベースライン($Y = 0$)から独立して描画し、半透明で重ね合わせます(デフォルト)。 |
"stack" |
先行する系列の上に順次積み上げ、全体の総量と各ストリームの寄与分を表現します。 |
classSeries#
AreaChart に登録された面データ系列を表す変更可能なデータモデルです。
class Series:
    def __init__(
        self,
        name: str,
        values: list[float],
        style: Style,
        fill_alpha: float | None = None,
        line_width: float = 2.0,
        line_style: LineStyle = "solid",
        point_shape: PointShape = "none",
        point_size: float = 1.0,
        legend_text_style: Style | None = None,
        *,
        show: bool = True,
        draw_ratio: float = 1.0,
        draw_direction: DrawDirection = "left_to_right",
    ) -> None: ...
パラメータ・属性#
| パラメータ/属性 | 型 | デフォルト | 説明 |
|---|---|---|---|
name |
str |
必須 | draw_legend() に表示される系列名。 |
values |
list[float] |
必須 | AreaChart.categories に対応する数値リスト。 |
style |
Style |
必須 | 面塗りつぶしおよび上端輪郭線の Style。 |
fill_alpha |
float | None |
None |
系列別の面不透明度上書き指定(None 時は AreaChart.fill_alpha を継承)。 |
line_width |
float |
2.0 |
上端境界ラインの線幅。 |
line_style |
"solid" | "dashed" | "dotted" | "dashdot" |
"solid" |
上端境界ラインの線種パターン。 |
point_shape |
"circle" | "square" | "rhombus" | "triangle" | "none" |
"none" |
show_points=True 時の頂点マーカー形状。 |
point_size |
float |
1.0 |
キャンバス単位での頂点マーカー半径(または半幅)。 |
legend_text_style |
Style | None |
None |
draw_legend() におけるこの系列専用の文字スタイル上書き指定。 |
show |
bool |
True |
全データの軸スケールを維持したまま表示/非表示を切り替えます。 |
draw_ratio |
float |
1.0 |
アニメーション用の部分描画比率(0.0〜1.0)。 |
draw_direction |
DrawDirection |
"left_to_right" |
部分描画の進行方向("left_to_right" または "bottom_to_top")。 |