drawlib.charts.gantt(ガントチャート)
セクション見出し行・進捗率付きタスクバー・ひし形マイルストーン・直交依存矢印・垂直マーカーラインを備えた 2D ガントチャート(工程表・ロードマップ)ビルダーです。drawlib.charts.gantt からインポートします(from drawlib.charts.gantt import Dependency, GanttChart, Marker, Milestone, Section, Task)。
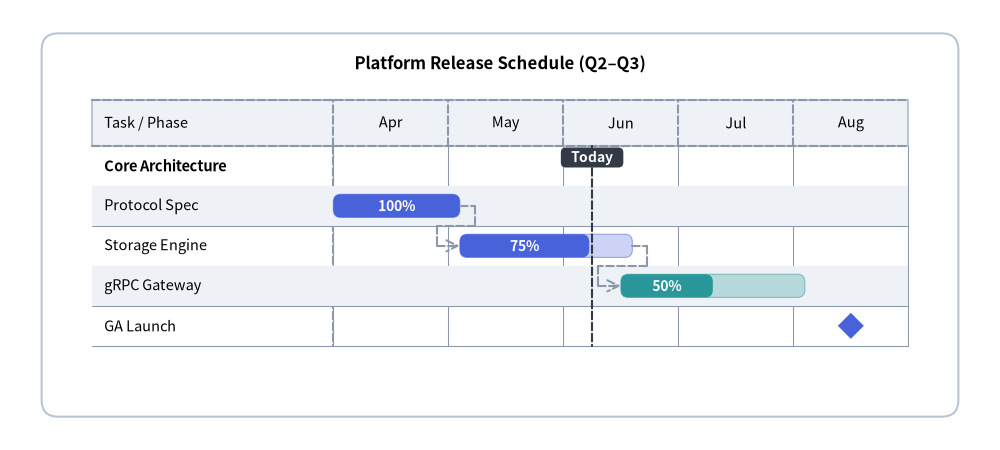
Source Code
from drawlib.canvas import save, setup
from drawlib.charts.gantt import GanttChart
from drawlib.shapes import rectangle
from drawlib.styles import Colors, Styles

setup(width=120, height=54)

card_style = Styles.Neutral.patch(shape_r=2.0, shape_line_color=Colors.Gray4, shape_fill_color=Colors.White)
rectangle((60.0, 27.0), width=110.0, height=46.0, style=card_style)

chart = GanttChart(
    columns=["Apr", "May", "Jun", "Jul", "Aug"],
    axis_line_style=Styles.MutedDashed,
    axis_text_style=Styles.Black.patch(text_size=10.5),
    grid_style=Styles.MutedThin,
    header_style=Styles.Neutral,
    zebra_style=Styles.NeutralFlat,
    progress_text_style=Styles.WhiteBold.patch(text_size=10.0),
    width=102.0,
    label_width=29.0,
    header_height=5.5,
    row_height=4.8,
    bar_radius=0.9,
    title="Platform Release Schedule (Q2–Q3)",
    title_style=Styles.BlackBold.patch(text_size=12.0),
)

chart.add_section("Core Architecture", text_style=Styles.BlackBold.patch(text_size=10.5))
t1 = chart.add_task("Protocol Spec", start="Apr", end=1.1, style=Styles.PrimaryFlat, progress=1.0)
t2 = chart.add_task("Storage Engine", start=1.1, end=2.6, style=Styles.PrimaryFlat, progress=0.75)
t3 = chart.add_task(
    "gRPC Gateway",
    start=2.5,
    end=4.1,
    style=Styles.SecondaryFlat,
    progress=0.50,
)
chart.add_milestone("GA Launch", at=4.5, style=Styles.PrimaryFlat)

chart.add_dependency(t1, t2)
chart.add_dependency(t2, t3)
chart.add_marker(at=2.25, style=Styles.DarkDashed, label="Today", label_style=Styles.WhiteBold.patch(text_size=10.0))

chart.draw(xy=(9.0, 6.0))
save()
classDependency#
GanttChart 内の 2 つの Task 行間を結ぶ直交依存関係矢印を表す変更可能なデータモデルです。
- 表示連動(カスケード):
from_taskまたはto_taskのいずれかがshow=Falseまたはdraw_ratio == 0.0の場合、接続する依存矢印も自動的に非表示になります。
class Dependency:
    def __init__(
        self,
        from_task: Task,
        to_task: Task,
        style: Style | None = None,
        show: bool = True,
    ) -> None: ...
パラメータ・属性#
| パラメータ/属性 | 型 | デフォルト | 説明 |
|---|---|---|---|
from_task |
Task |
必須 | 矢印の始点となる先行 Task。 |
to_task |
Task |
必須 | 矢印の終点となる後続 Task。 |
style |
Style | None |
None |
コネクタ矢印の Style 上書き指定(None 時は標準の直交矢印スタイル)。 |
show |
bool |
True |
依存関係矢印の表示/非表示を切り替えます。 |
typeDrawDirection#
Task.draw_ratio(0.0〜1.0)と組み合わせてタスクバーの部分描画方向を指定するリテラル型です。
DrawDirection = Literal["bottom_to_top", "left_to_right"]
| リテラル値 | GanttChart Task での動作 |
|---|---|
"left_to_right" |
タスクバーを start から start + (end - start) * draw_ratio まで水平方向に伸長します(デフォルト)。 |
"bottom_to_top" |
タスクバーを下端から上方向へ垂直に拡大します(bar_height * draw_ratio)。 |
classGanttChart#
水平タイムライン列に対してセクション・タスク・マイルストーンを上から下へ順次配置する 2D ガントチャートビルダーです。
- 座標アンカー:
draw(xy=..., align="bottom_left")のデフォルトは左下(x0, y0)(align="center"指定時は中心)。 - 時間軸位置の指定(
start,end,at):columns内の列名文字列(start="Apr"は左端、end="Apr"は右端、at="Jun"は列中央)またはfloatオフセット値(0.0は第 0 列の左端、1.5は第 1 列の中央)の両方を受け付けます。
class GanttChart:
    def __init__(
        self,
        *,
        columns: list[str],
        axis_line_style: Style,
        axis_text_style: Style | None = None,
        header_style: Style | None = None,
        grid_style: Style | None = None,
        zebra_style: Style | None = None,
        progress_text_style: Style | None = None,
        background_style: Style | None = None,
        title: str = "",
        title_style: Style | None = None,
        width: float = 90.0,
        height: float | None = None,
        row_height: float = 4.5,
        header_height: float = 5.5,
        label_width: float = 24.0,
        bar_radius: float = 0.8,
    ) -> None: ...
パラメータ#
| パラメータ | 型 | デフォルト | 説明 |
|---|---|---|---|
columns |
list[str] |
必須 | 上部ヘッダー帯に並べるタイムライン列ラベルのリスト(1 要素以上必須)。 |
axis_line_style |
Style |
必須 | 列境界線およびヘッダー下線の必須スタイル。 |
axis_text_style |
Style | None |
None |
列ヘッダーおよび左列のタスク・マイルストーン名の文字スタイル。None の場合は非表示。 |
header_style |
Style | None |
None |
上部タイムライン列ヘッダー帯の背景・枠線スタイル。None の場合は非表示。 |
grid_style |
Style | None |
None |
全行を縦断するタイムライン列区切り線のスタイル。None の場合は非表示。 |
zebra_style |
Style | None |
None |
1 行おきの水平ストライプ背景スタイル。None の場合は非表示。 |
progress_text_style |
Style | None |
None |
タスク進捗率ラベル("75%" など)のデフォルト文字スタイル。None の場合は非表示。 |
background_style |
Style | None |
None |
チャート外枠カードのスタイル。None の場合は非表示。 |
title |
str |
"" |
スケジュールヘッダー上部に表示するチャートタイトル文字列。 |
title_style |
Style | None |
None |
title を描画するための文字スタイル。None の場合は非表示。 |
width |
float |
90.0 |
キャンバス単位でのチャート全体の幅。 |
height |
float | None |
None |
チャート全体の高さ。None の場合は総行数から動的に自動算出されます。 |
row_height |
float |
4.5 |
セクション・タスク・マイルストーン 1 行あたりの高さ(キャンバス単位)。 |
header_height |
float |
5.5 |
上部タイムライン列ヘッダー帯の高さ。 |
label_width |
float |
24.0 |
左側の行ラベル列に割り当てる水平幅。 |
bar_radius |
float |
0.8 |
task.style.shape_r が None の場合に適用されるタスクバーの角丸半径。 |
メソッド・プロパティ#
add_dependency
def add_dependency(
    self,
    from_task: Task,
    to_task: Task,
    style: Style | None = None,
    *,
    show: bool = True,
) -> Dependency
from_task から to_task へ直交依存関係矢印を追加し、変更可能な Dependency インスタンスを返します。
add_marker
def add_marker(
    self,
    at: str | float,
    style: Style,
    label: str = "",
    label_style: Style | None = None,
    *,
    show: bool = True,
) -> Marker
位置 at に全行縦断の垂直基準線と任意の上部バッジ(label + label_style)を追加し、変更可能な Marker インスタンスを返します。
add_milestone
def add_milestone(
    self,
    name: str,
    at: str | float,
    style: Style,
    *,
    show: bool = True,
) -> Milestone
位置 at にひし形マーカーを持つマイルストーン行を追加し、変更可能な Milestone インスタンスを返します。
add_section
def add_section(
    self,
    name: str,
    style: Style | None = None,
    text_style: Style | None = None,
    *,
    show: bool = True,
) -> Section
カテゴリ区切りのセクション見出し行を追加し、変更可能な Section インスタンスを返します。
add_task
def add_task(
    self,
    name: str,
    start: str | float,
    end: str | float,
    style: Style,
    progress: float = 0.0,
    progress_text_style: Style | None = None,
    *,
    show: bool = True,
    draw_ratio: float = 1.0,
    draw_direction: DrawDirection = "left_to_right",
) -> Task
期間 [start, end] にわたるスケジュールタスクバー(および進捗率 progress 0.0〜1.0)を追加し、変更可能な Task インスタンスを返します。
columns *(property)*
@property
def columns(self) -> list[str]
タイムライン列ラベルのリストコピーを返します。
dependencies *(property)*
@property
def dependencies(self) -> list[Dependency]
登録済みの Dependency 矢印のリストコピーを返します。
draw
def draw(
    self,
    xy: tuple[float, float] = (0.0, 0.0),
    *,
    width: float | None = None,
    height: float | None = None,
    align: Literal["bottom_left", "center"] = "bottom_left",
    scale: float = 1.0,
) -> None
基準座標 xy(デフォルトは左下 (x0, y0)、align="center" で中心)にガントチャートを描画します。
get_size
def get_size(self) -> tuple[float, float]
チャートコンテナ全体の (width, height) 寸法を算出して返します。
items *(property)*
@property
def items(self) -> list[Task | Section | Milestone]
登録済みのスケジュール行(Task, Section, Milestone)を上から下の順で格納したリストコピーを返します。
markers *(property)*
@property
def markers(self) -> list[Marker]
登録済みの垂直基準線 Marker のリストコピーを返します。
classMarker#
全スケジュール行を縦断する垂直基準線("Today" や "Code Freeze" など)を表す変更可能なデータモデルです。
class Marker:
    def __init__(
        self,
        at: str | float,
        style: Style,
        label: str = "",
        label_style: Style | None = None,
        show: bool = True,
    ) -> None: ...
パラメータ・属性#
| パラメータ/属性 | 型 | デフォルト | 説明 |
|---|---|---|---|
at |
str | float |
必須 | 列名(列中央)または浮動小数点のタイムライン境界オフセット。 |
style |
Style |
必須 | 垂直基準線および上部バッジ塗りの Style。 |
label |
str |
"" |
垂直マーカー上部に表示する任意のバッジ文字列。 |
label_style |
Style | None |
None |
label の文字スタイル。 |
show |
bool |
True |
垂直マーカーの表示/非表示を切り替えます。 |
classMilestone#
GanttChart 内の期間ゼロのマイルストーンイベント行(ひし形マーカー)を表す変更可能なデータモデルです。
class Milestone:
    def __init__(
        self,
        name: str,
        at: str | float,
        style: Style,
        show: bool = True,
    ) -> None: ...
パラメータ・属性#
| パラメータ/属性 | 型 | デフォルト | 説明 |
|---|---|---|---|
name |
str |
必須 | 左ラベル列に表示されるマイルストーン名。 |
at |
str | float |
必須 | ひし形マーカーを配置する列名(中央)または浮動小数点位置。 |
style |
Style |
必須 | ひし形マーカーの塗り・枠線 Style。 |
show |
bool |
True |
行レイアウト間隔を保ったままマイルストーンの表示/非表示を切り替えます。 |
classSection#
GanttChart 内の全幅カテゴリ区分バナー行を表す変更可能なデータモデルです。
class Section:
    def __init__(
        self,
        name: str,
        style: Style | None = None,
        text_style: Style | None = None,
        show: bool = True,
    ) -> None: ...
パラメータ・属性#
| パラメータ/属性 | 型 | デフォルト | 説明 |
|---|---|---|---|
name |
str |
必須 | セクション見出しテキスト。 |
style |
Style | None |
None |
バナー矩形の背景・枠線 Style 上書き指定。 |
text_style |
Style | None |
None |
name 専用の文字スタイル上書き指定(None 時は GanttChart.axis_text_style を使用)。 |
show |
bool |
True |
行レイアウト間隔を保ったままセクションの表示/非表示を切り替えます。 |
classTask#
GanttChart 内の期間 [start, end] にわたるスケジュールタスクバーを表す変更可能なデータモデルです。
class Task:
    def __init__(
        self,
        name: str,
        start: str | float,
        end: str | float,
        style: Style,
        progress: float = 0.0,
        progress_text_style: Style | None = None,
        show: bool = True,
        draw_ratio: float = 1.0,
        draw_direction: DrawDirection = "left_to_right",
    ) -> None: ...
パラメータ・属性#
| パラメータ/属性 | 型 | デフォルト | 説明 |
|---|---|---|---|
name |
str |
必須 | 左ラベル列に表示されるタスク名。 |
start |
str | float |
必須 | 開始列名(左端)または浮動小数点タイムラインオフセット。 |
end |
str | float |
必須 | 終了列名(右端)または浮動小数点タイムラインオフセット。 |
style |
Style |
必須 | タスクバーの塗り Style(progress > 0 時は未完了区間が半透明ティントで描画されます)。 |
progress |
float |
0.0 |
[0.0, 1.0] にクランプされる完了進捗率。 |
progress_text_style |
Style | None |
None |
このタスク専用の進捗率文字スタイル(None 時は GanttChart.progress_text_style を使用)。 |
show |
bool |
True |
行位置を保ったままタスクバー(および接続する Dependency 矢印)の表示/非表示を切り替えます。 |
draw_ratio |
float |
1.0 |
アニメーション用の部分描画比率(0.0〜1.0)。 |
draw_direction |
DrawDirection |
"left_to_right" |
部分描画方向("left_to_right" 水平伸長/"bottom_to_top" 垂直拡大)。 |