drawlib.charts.heatmap(ヒートマップ・サーマルオーバーレイ)
自動コントラスト文字ラベル付きの 2D マトリクスヒートマップ(HeatmapChart)と、アーキテクチャ図・クラス図・地図上に重ね合わせる空間サーマルホットスポットオーバーレイ(HeatmapOverlay)を提供します。drawlib.charts.heatmap からインポートします(from drawlib.charts.heatmap import Cell, HeatmapChart, HeatmapOverlay, Row, Spot)。
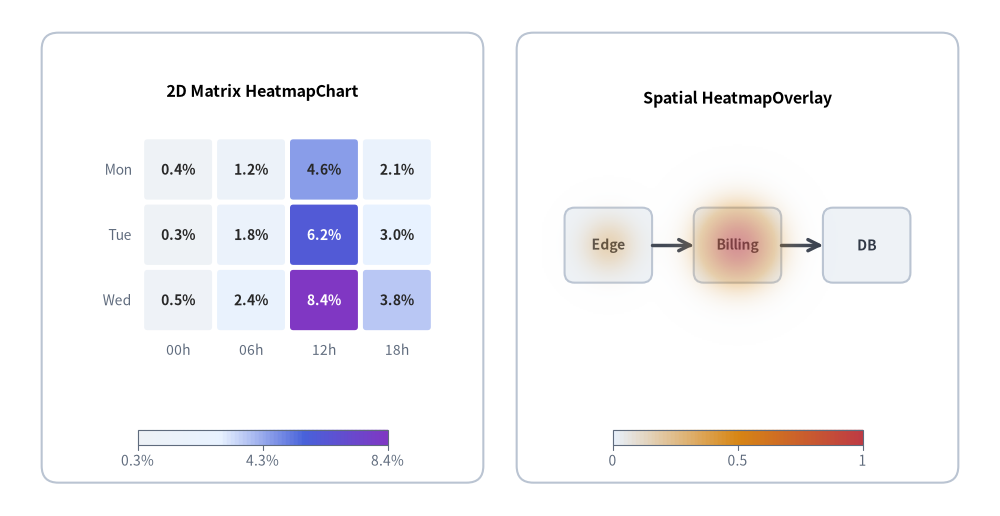
Source Code
from drawlib.canvas import save, setup
from drawlib.charts.heatmap import HeatmapChart, HeatmapOverlay
from drawlib.lines import line
from drawlib.shapes import rectangle
from drawlib.styles import Colors, Styles

setup(width=120, height=62)

card_style = Styles.Neutral.patch(shape_r=2.0, shape_line_color=Colors.Gray4, shape_fill_color=Colors.White)
rectangle((31.5, 31.0), width=53.0, height=54.0, style=card_style)
rectangle((88.5, 31.0), width=53.0, height=54.0, style=card_style)

# Left: 2D Matrix HeatmapChart + Continuous Colorbar
matrix = HeatmapChart(
    styles=[Styles.Neutral, Styles.PrimaryNeutral, Styles.PrimaryFlat, Styles.AccentFlat],
    x_categories=["00h", "06h", "12h", "18h"],
    axis_text_style=Styles.Muted.patch(text_size=10.0),
    value_text_style=Styles.BlackBold.patch(text_size=10.0),
    width=47.0,
    height=37.0,
    cell_gap=0.6,
    cell_r=0.4,
    value_format="{:.1f}%",
    title="2D Matrix HeatmapChart",
    title_style=Styles.BlackBold.patch(text_size=11.5),
)
matrix.add_row("Mon", [0.4, 1.2, 4.6, 2.1])
matrix.add_row("Tue", [0.3, 1.8, 6.2, 3.0])
matrix.add_row("Wed", [0.5, 2.4, 8.4, 3.8])
matrix.draw(xy=(8.0, 16.5))
matrix.draw_colorbar(xy=(16.5, 8.5), text_style=Styles.Muted.patch(text_size=10.0), length=30.0, thickness=1.8, num_ticks=3)

# Right: Spatial Thermal HeatmapOverlay over Service Nodes
rectangle((73.0, 32.5), width=10.5, height=9.0, style=Styles.Neutral.patch(shape_r=1.2), text="Edge", text_style=Styles.DarkBold.patch(text_size=10.0))
rectangle((88.5, 32.5), width=10.5, height=9.0, style=Styles.Neutral.patch(shape_r=1.2), text="Billing", text_style=Styles.DarkBold.patch(text_size=10.0))
rectangle((104.0, 32.5), width=10.5, height=9.0, style=Styles.Neutral.patch(shape_r=1.2), text="DB", text_style=Styles.DarkBold.patch(text_size=10.0))
line((78.25, 32.5), (83.25, 32.5), arrow_head="->", style=Styles.DarkBold)
line((93.75, 32.5), (98.75, 32.5), arrow_head="->", style=Styles.DarkBold)

overlay = HeatmapOverlay(
    styles=[Styles.PrimaryNeutral, Styles.WarningFlat, Styles.DangerFlat],
    width=47.0,
    height=30.0,
    mode="smooth",
    max_alpha=0.55,
    title="Spatial HeatmapOverlay",
    title_style=Styles.BlackBold.patch(text_size=11.5),
)
overlay.add_spot((23.5, 15.0), value=0.95, radius=10.5)
overlay.add_spot((8.0, 15.0), value=0.45, radius=7.5)
overlay.draw(xy=(65.0, 17.5))
overlay.draw_colorbar(xy=(73.5, 8.5), text_style=Styles.Muted.patch(text_size=10.0), length=30.0, thickness=1.8, num_ticks=3)

save()
typeBlendMode#
HeatmapOverlay で mode="smooth" の際に重なり合うガウシアンホットスポットの強度合成方式を指定するリテラル型です。
BlendMode = Literal["add", "max"]
| リテラル値 | 説明 |
|---|---|
"add" |
重なり合うホットスポットの強度を加算合成します(max_value でクランプ、デフォルト)。 |
"max" |
重なり合うホットスポットのうち各点で最大の強度値を採用します。 |
classCell#
HeatmapChart において HeatmapChart.set_cell() で登録される個別セル上書きを表す変更可能なデータモデルです。
class Cell:
    def __init__(
        self,
        x: int,
        y: int,
        value: float | None,
        *,
        label: str = "",
        style: Style | None = None,
        show: bool = True,
    ) -> None: ...
パラメータ・属性#
| パラメータ/属性 | 型 | デフォルト | 説明 |
|---|---|---|---|
x |
int |
必須 | 0 始まりの列インデックス。 |
y |
int |
必須 | 0 始まりの行インデックス。 |
value |
float | None |
必須 | セルの数値(None は空セルを描画)。 |
label |
str |
"" |
数値フォーマット結果を上書きするカスタム表示ラベル。 |
style |
Style | None |
None |
カラースケール塗り・枠線をこのセルだけ上書きするカスタム Style。 |
show |
bool |
True |
このセルを描画するかどうかを切り替えます。 |
typeDrawDirection#
Row.draw_ratio(0.0〜1.0)と組み合わせてマトリクスヒートマップ行の部分描画方向を指定するリテラル型です。
DrawDirection = Literal["bottom_to_top", "left_to_right"]
| リテラル値 | HeatmapChart Row での動作 |
|---|---|
"left_to_right" |
左の列から右の列へ順番にセルを出現させ、境界セルの幅を滑らかに補間します(デフォルト)。 |
"bottom_to_top" |
行内の全セルを下端から上方向へ垂直に拡大します(cell_height * draw_ratio)。 |
typeFormatterType#
マトリクスセル値(value_format)・ホットスポット注釈・カラーバー目盛りの数値フォーマットを指定するユニオン型です。
FormatterType = str | Callable[[float], str] | None
str: Python フォーマット文字列(例:"{:.1f}%","{:.2f}")。Callable[[float], str]:floatを受け取りstrを返すカスタム関数。None: コンパクトな自動数値フォーマット。
classHeatmapChart#
Style ベースの多段階カラーパレット(styles=[Style, ...] または min_style + max_style)を連続補間してセル塗りを決定する 2D マトリクス/グリッドヒートマップビルダーです。
- 座標アンカー:
draw(xy=..., align="bottom_left")のデフォルトは左下(x0, y0)(align="center"指定時は中心)。 - パレット指定条件:
styles(低温〜高温の 2 要素以上のStyleリスト)またはmin_styleとmax_styleのペアのいずれかが必須です。
class HeatmapChart:
    def __init__(
        self,
        *,
        styles: list[Style] | None = None,
        min_style: Style | None = None,
        max_style: Style | None = None,
        x_categories: list[str] | None = None,
        y_categories: list[str] | None = None,
        axis_line_style: Style | None = None,
        width: float = 80.0,
        height: float = 55.0,
        min_value: float | None = None,
        max_value: float | None = None,
        cell_gap: float = 0.6,
        cell_r: float = 0.4,
        cell_line_style: Style | None = None,
        value_format: FormatterType = None,
        auto_contrast_text: bool = True,
        x_label_position: Literal["bottom", "top"] = "bottom",
        y_origin: Literal["top", "bottom"] = "top",
        axis_text_style: Style | None = None,
        value_text_style: Style | None = None,
        background_style: Style | None = None,
        title: str = "",
        title_style: Style | None = None,
    ) -> None: ...
パラメータ#
| パラメータ | 型 | デフォルト | 説明 |
|---|---|---|---|
styles |
list[Style] | None |
None |
min_value から max_value へ補間する 2 個以上の Style カラースケールリスト。 |
min_style |
Style | None |
None |
styles 省略時の最小値側 Style(max_style と併用)。 |
max_style |
Style | None |
None |
styles 省略時の最大値側 Style(min_style と併用)。 |
x_categories |
list[str] | None |
None |
水平 X 軸に沿った列カテゴリ名リスト。 |
y_categories |
list[str] | None |
None |
垂直 Y 軸に沿った行カテゴリ名リスト(None 時は add_row() で自動追加)。 |
axis_line_style |
Style | None |
None |
マトリクス外枠フレーム線のスタイル。 |
width |
float |
80.0 |
キャンバス単位でのチャート全体の幅。 |
height |
float |
55.0 |
キャンバス単位でのチャート全体の高さ。 |
min_value |
float | None |
None |
カラースケールの最小値。None の場合はセルデータから自動推定。 |
max_value |
float | None |
None |
カラースケールの最大値。None の場合はセルデータから自動推定。 |
cell_gap |
float |
0.6 |
隣接セル間の隙間(キャンバス単位)。 |
cell_r |
float |
0.4 |
マトリクスセルの角丸半径。 |
cell_line_style |
Style | None |
None |
セル枠線ストロークを上書きするスタイル。 |
value_format |
FormatterType |
None |
セル内数値ラベル用のフォーマット文字列または関数。 |
auto_contrast_text |
bool |
True |
セル背景色の輝度に応じてセル内文字色を濃色/白色へ自動切替します。 |
x_label_position |
"bottom" | "top" |
"bottom" |
X 軸列カテゴリラベルの上下配置位置。 |
y_origin |
"top" | "bottom" |
"top" |
第 0 行を上端("top")または下端("bottom")のどちらに配置するか。 |
axis_text_style |
Style | None |
None |
行・列カテゴリラベルの文字スタイル。None の場合は非表示。 |
value_text_style |
Style | None |
None |
セル内数値ラベルの文字スタイル。None の場合は非表示。 |
background_style |
Style | None |
None |
チャート外枠カードのスタイル。None の場合は非表示。 |
title |
str |
"" |
コンテナ上部に表示するチャートタイトル文字列。 |
title_style |
Style | None |
None |
title を描画するための文字スタイル。None の場合は非表示。 |
メソッド・プロパティ#
add_row
def add_row(
    self,
    name: str,
    values: Sequence[float | None],
    *,
    show: bool = True,
    draw_ratio: float = 1.0,
    draw_direction: DrawDirection = "left_to_right",
) -> Row
マトリクスに水平行を追加し(None は空セル)、変更可能な Row インスタンスを返します。
cells *(property)*
@property
def cells(self) -> list[Cell]
登録済みの個別セル上書き Cell のリストコピーを返します。
color_stops *(property)*
@property
def color_stops(self) -> list[Color]
設定された Style ストップから抽出された Color リストを返します。
draw
def draw(
    self,
    xy: tuple[float, float] = (0.0, 0.0),
    *,
    width: float | None = None,
    height: float | None = None,
    align: Literal["bottom_left", "center"] = "bottom_left",
    scale: float = 1.0,
) -> None
基準座標 xy(デフォルトは左下 (x0, y0)、align="center" で中心)にヒートマップマトリクスを描画します。
draw_colorbar
def draw_colorbar(
    self,
    xy: tuple[float, float],
    text_style: Style,
    *,
    length: float = 30.0,
    thickness: float = 2.2,
    orientation: Orientation = "horizontal",
    num_ticks: int = 5,
    value_format: FormatterType = None,
    label: str = "",
    border_style: Style | None = None,
    scale: float = 1.0,
) -> None
左下座標 xy を基準に連続グラデーションカラーバー凡例を描画します。
draw_legend
def draw_legend(
    self,
    xy: tuple[float, float],
    text_style: Style,
    orientation: Orientation = "vertical",
    swatch_width: float = 2.4,
    swatch_height: float = 1.2,
    item_gap: float = 4.0,
    *,
    num_steps: int = 5,
    labels: Sequence[str] | None = None,
    scale: float = 1.0,
) -> None
座標 xy に段階的な離散カラースウォッチ凡例(num_steps または明示 labels)を描画します。
get_size
def get_size(self) -> tuple[float, float]
ヒートマップコンテナの全体寸法 (width, height) をキャンバス単位で返します。
rows *(property)*
@property
def rows(self) -> list[Row]
登録済みのマトリクス行 Row インスタンスのリストコピーを返します。
set_cell
def set_cell(
    self,
    x: int | str,
    y: int | str,
    value: float | None,
    *,
    label: str = "",
    style: Style | None = None,
    show: bool = True,
) -> Cell
0 始まりインデックスまたはカテゴリ名(列 x、行 y)で特定セルを設定・上書きし、Cell インスタンスを返します。
set_data
def set_data(
    self,
    values: Sequence[Sequence[float | None]],
    *,
    x_categories: Sequence[str] | None = None,
    y_categories: Sequence[str] | None = None,
) -> HeatmapChart
2 次元配列で全マトリクス行を一括置換し、メソッドチェーン用に self を返します。
styles *(property)*
@property
def styles(self) -> list[Style]
ヒートマップカラースケールを定義する Style ストップのリストコピーを返します。
classHeatmapOverlay#
各種ダイアグラム(ClassDiagram・ArchitectureDiagram・GeoMap など)やキャンバス領域上に、ガウシアン熱分布(mode="smooth")または同心等高線リング(mode="contour")を重ね合わせる空間サーマルオーバーレイです。
- 座標アンカー:
draw(xy=..., align="bottom_left")のデフォルトは左下(x0, y0)(align="center"指定時は中心)。(0.0, 0.0)に描画したダイアグラム上に重ねる場合はoverlay.draw(xy=(0.0, 0.0))を渡すことでノード座標と 1 対 1 に一致します。
class HeatmapOverlay:
    def __init__(
        self,
        *,
        styles: list[Style] | None = None,
        min_style: Style | None = None,
        max_style: Style | None = None,
        width: float | None = None,
        height: float | None = None,
        mode: OverlayMode = "smooth",
        blend_mode: BlendMode = "add",
        min_value: float = 0.0,
        max_value: float = 1.0,
        default_radius: float = 15.0,
        max_alpha: float = 0.55,
        levels: int = 4,
        show_contour_lines: bool = True,
        contour_line_width: float = 1.0,
        resolution: int = 240,
        value_format: FormatterType = None,
        value_text_style: Style | None = None,
        border_style: Style | None = None,
        title: str = "",
        title_style: Style | None = None,
    ) -> None: ...
パラメータ#
| パラメータ | 型 | デフォルト | 説明 |
|---|---|---|---|
styles |
list[Style] | None |
None |
min_value から max_value に対応する 2 個以上の Style カラーストップ。 |
min_style |
Style | None |
None |
styles 省略時の最小強度側 Style(max_style と併用)。 |
max_style |
Style | None |
None |
styles 省略時の最大強度側 Style(min_style と併用)。 |
width |
float | None |
None |
オーバーレイ領域の固定幅。None 時は get_bounds() により全スポットから自動算出。 |
height |
float | None |
None |
オーバーレイ領域の固定高さ。None 時は get_bounds() により全スポットから自動算出。 |
mode |
OverlayMode |
"smooth" |
描画モード("smooth" ガウシアン熱分布/"contour" ベクター等高線リング)。 |
blend_mode |
BlendMode |
"add" |
スムーススポット重複時の強度合成モード("add" 加算/"max" 最大値)。 |
min_value |
float |
0.0 |
最小カラーストップに対応する強度下限値。 |
max_value |
float |
1.0 |
最大カラーストップに対応する強度上限値。 |
default_radius |
float |
15.0 |
add_spot() で radius 省略時に使われるデフォルト影響半径(キャンバス単位)。 |
max_alpha |
float |
0.55 |
下層のダイアグラムを読みやすく保つためのピーク中心の最大不透明度(0.05〜1.0)。 |
levels |
int |
4 |
mode="contour" 時の各スポットあたりの同心等高線リング数。 |
show_contour_lines |
bool |
True |
mode="contour" 時に等高線リングの輪郭線を描画するか。 |
contour_line_width |
float |
1.0 |
mode="contour" 時の等高線リング線幅。 |
resolution |
int |
240 |
mode="smooth" 時の長辺方向のラスタ計算グリッド解像度(32〜1024)。 |
value_format |
FormatterType |
None |
スポット数値ラベル用のフォーマット文字列または関数。 |
value_text_style |
Style | None |
None |
スポット注釈ラベルの文字スタイル。 |
border_style |
Style | None |
None |
オーバーレイ領域外枠を描画するスタイル。 |
title |
str |
"" |
オーバーレイ領域上部に表示するタイトル文字列。 |
title_style |
Style | None |
None |
title を描画するための文字スタイル。None の場合は非表示。 |
メソッド・プロパティ#
add_spot
def add_spot(
    self,
    xy: tuple[float, float] | _HasXYProtocol,
    value: float = 1.0,
    radius: float | None = None,
    *,
    label: str = "",
    label_style: Style | None = None,
    style: Style | None = None,
    show: bool = True,
    draw_ratio: float = 1.0,
) -> Spot
座標タプル (x, y) または .xy 属性を持つ任意のダイアグラムノード位置にサーマルホットスポットを追加し、変更可能な Spot インスタンスを返します。
color_stops *(property)*
@property
def color_stops(self) -> list[Color]
設定された Style ストップから抽出された Color リストを返します。
draw
def draw(
    self,
    xy: tuple[float, float] = (0.0, 0.0),
    *,
    width: float | None = None,
    height: float | None = None,
    align: Literal["bottom_left", "center"] = "bottom_left",
    scale: float = 1.0,
) -> None
基準座標 xy(デフォルトは左下 (x0, y0)、align="center" で中心)にサーマルヒートマップオーバーレイを描画します。
draw_colorbar
def draw_colorbar(
    self,
    xy: tuple[float, float],
    text_style: Style,
    *,
    length: float = 30.0,
    thickness: float = 2.2,
    orientation: Orientation = "horizontal",
    num_ticks: int = 5,
    value_format: FormatterType = None,
    label: str = "",
    border_style: Style | None = None,
    scale: float = 1.0,
) -> None
左下座標 xy を基準にサーマルオーバーレイ用の連続グラデーションカラーバー凡例を描画します。
draw_legend
def draw_legend(
    self,
    xy: tuple[float, float],
    text_style: Style,
    orientation: Orientation = "vertical",
    swatch_width: float = 2.4,
    swatch_height: float = 1.2,
    item_gap: float = 4.0,
    *,
    num_steps: int = 4,
    labels: Sequence[str] | None = None,
    scale: float = 1.0,
) -> None
座標 xy に段階的な離散カラースウォッチ凡例(num_steps または labels=["Low", "High"] など)を描画します。
get_bounds
def get_bounds(self) -> tuple[float, float, float, float]
登録済み全スポットを包含するローカル境界ボックス (min_x, min_y, max_x, max_y) を算出します。
get_size
def get_size(self) -> tuple[float, float]
get_bounds() からオーバーレイ領域全体の (width, height) 寸法を算出します。
spots *(property)*
@property
def spots(self) -> list[Spot]
登録済みのサーマルホットスポット Spot のリストコピーを返します。
styles *(property)*
@property
def styles(self) -> list[Style]
サーマルカラースケールを定義する Style ストップのリストコピーを返します。
typeOrientation#
カラーバーの向き(draw_colorbar)または離散スウォッチ凡例の並び方向(draw_legend)を指定するリテラル型です。
Orientation = Literal["vertical", "horizontal"]
| リテラル値 | 説明 |
|---|---|
"vertical" |
縦向きのグラデーションカラーバー、または上から下へ並ぶ凡例スウォッチを描画します。 |
"horizontal" |
横向きのグラデーションカラーバー、または左から右へ並ぶ凡例スウォッチを描画します。 |
typeOverlayMode#
HeatmapOverlay の空間レンダリング方式を選択するリテラル型です。
OverlayMode = Literal["smooth", "contour"]
| リテラル値 | 説明 |
|---|---|
"smooth" |
連続的な 2D ガウシアン熱グラデーションフィールド(resolution 解像度)を描画します(デフォルト)。 |
"contour" |
各ホットスポット周囲に levels 段の同心ベクター等高線リングを描画します。 |
classRow#
HeatmapChart 内の水平マトリクス行を表す変更可能なデータモデルです。
class Row:
    def __init__(
        self,
        name: str,
        values: Sequence[float | None],
        *,
        show: bool = True,
        draw_ratio: float = 1.0,
        draw_direction: DrawDirection = "left_to_right",
    ) -> None: ...
パラメータ・属性#
| パラメータ/属性 | 型 | デフォルト | 説明 |
|---|---|---|---|
name |
str |
必須 | Y 軸に沿って表示される行カテゴリラベル。 |
values |
Sequence[float | None] |
必須 | 各列のセル数値(空セルは None)のシーケンス。 |
show |
bool |
True |
カラースケール範囲およびマトリクス配置を維持したまま表示/非表示を切り替えます。 |
draw_ratio |
float |
1.0 |
アニメーション用の部分描画比率(0.0〜1.0)。 |
draw_direction |
DrawDirection |
"left_to_right" |
部分描画方向("left_to_right" 列スイープ/"bottom_to_top" セル拡大)。 |
classSpot#
HeatmapOverlay 内の空間サーマルホットスポットを表す変更可能なデータモデルです。
- 座標アンカー: 中心
(cx, cy)(xyはホットスポットのピーク中心座標を指定します)。
class Spot:
    def __init__(
        self,
        xy: tuple[float, float],
        value: float = 1.0,
        radius: float = 15.0,
        *,
        label: str = "",
        label_style: Style | None = None,
        style: Style | None = None,
        show: bool = True,
        draw_ratio: float = 1.0,
    ) -> None: ...
パラメータ・属性#
| パラメータ/属性 | 型 | デフォルト | 説明 |
|---|---|---|---|
xy |
tuple[float, float] |
必須 | サーマルホットスポットの中心座標 (cx, cy)。 |
value |
float |
1.0 |
[min_value, max_value] にマッピングされる熱強度/スコア値。 |
radius |
float |
15.0 |
キャンバス単位でのホットスポット影響半径。 |
label |
str |
"" |
ホットスポット中心に表示する任意の注釈テキスト。 |
label_style |
Style | None |
None |
label 専用の文字スタイル(None 時は HeatmapOverlay.value_text_style を使用)。 |
style |
Style | None |
None |
ホットスポットのピーク色・等高線色を上書きするカスタム Style。 |
show |
bool |
True |
自動算出される境界範囲を維持したまま表示/非表示を切り替えます。 |
draw_ratio |
float |
1.0 |
アニメーション用に強度および影響半径を [0.0, 1.0] でスケーリングします。 |