drawlib.charts.scatter
2D scatter and multidimensional bubble chart builder mapping continuous numerical (x, y) and (x, y, radius) data across independent linear or logarithmic Cartesian axes. Import from drawlib.charts.scatter (from drawlib.charts.scatter import Axis, Point, ScatterChart, Series).
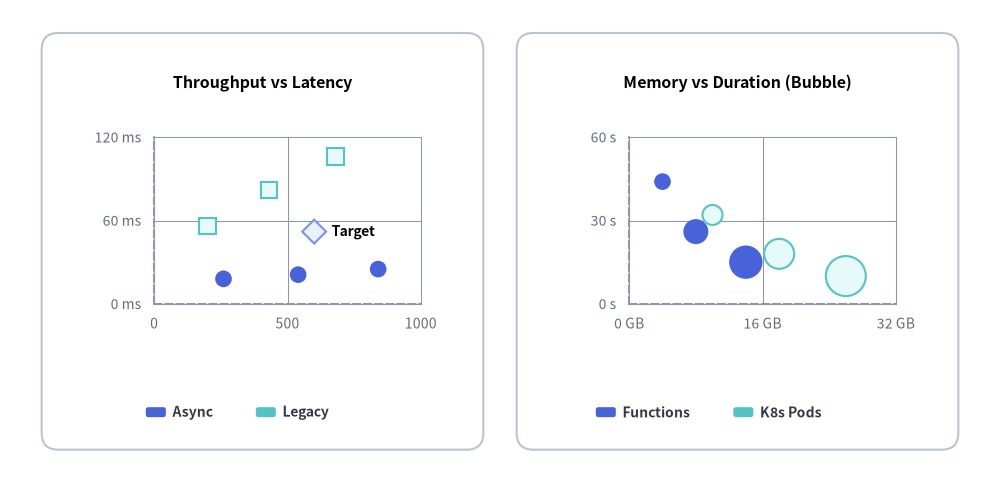
Source Code
from drawlib.canvas import save, setup
from drawlib.charts.scatter import ScatterChart
from drawlib.shapes import rectangle
from drawlib.styles import Colors, Styles

setup(width=120, height=58)

card_style = Styles.Neutral.patch(shape_r=2.0, shape_line_color=Colors.Gray4, shape_fill_color=Colors.White)
rectangle((31.5, 29.0), width=53.0, height=50.0, style=card_style)
rectangle((88.5, 29.0), width=53.0, height=50.0, style=card_style)

# Left: Benchmark Scatter with Annotated Point & Series
sc = ScatterChart(
    axis_line_style=Styles.MutedDashed,
    axis_text_style=Styles.Muted.patch(text_size=10.0),
    value_text_style=Styles.BlackBold.patch(text_size=10.0),
    grid_style=Styles.MutedThin,
    width=48.0,
    height=37.0,
    title="Throughput vs Latency",
    title_style=Styles.BlackBold.patch(text_size=11.5),
)
sc.configure_x_axis(min_value=0.0, max_value=1000.0, tick_step=500.0)
sc.configure_y_axis(min_value=0.0, max_value=120.0, tick_step=60.0, unit="ms")
sc.add(xy=(600.0, 52.0), style=Styles.PrimaryNeutral, radius=1.3, shape="rhombus", label="Target")
sc.add_series("Async", [(260.0, 18.0), (540.0, 21.0), (840.0, 25.0)], style=Styles.PrimaryFlat, radius=1.0, shape="circle")
sc.add_series("Legacy", [(200.0, 56.0), (430.0, 82.0), (680.0, 106.0)], style=Styles.SecondaryNeutral, radius=1.0, shape="square")
sc.draw(xy=(7.5, 13.5))
sc.draw_legend(xy=(17.5, 8.5), text_style=Styles.DarkBold.patch(text_size=10.0), orientation="horizontal")

# Right: Multidimensional Bubble Chart (x, y, radius)
bub = ScatterChart(
    axis_line_style=Styles.MutedDashed,
    axis_text_style=Styles.Muted.patch(text_size=10.0),
    grid_style=Styles.MutedThin,
    width=48.0,
    height=37.0,
    title="Memory vs Duration (Bubble)",
    title_style=Styles.BlackBold.patch(text_size=11.5),
)
bub.configure_x_axis(min_value=0.0, max_value=32.0, tick_step=16.0, unit="GB")
bub.configure_y_axis(min_value=0.0, max_value=60.0, tick_step=30.0, unit="s")
bub.add_series("Functions", [(4.0, 44.0, 1.0), (8.0, 26.0, 1.5), (14.0, 15.0, 2.0)], style=Styles.PrimaryFlat, shape="circle")
bub.add_series("K8s Pods", [(10.0, 32.0, 1.2), (18.0, 18.0, 1.8), (26.0, 10.0, 2.4)], style=Styles.SecondaryNeutral, shape="circle")
bub.draw(xy=(64.5, 13.5))
bub.draw_legend(xy=(71.5, 8.5), text_style=Styles.DarkBold.patch(text_size=10.0), orientation="horizontal", item_gap=2.5)

save()
classAxis#
Represents a continuous numerical coordinate axis (x_axis or y_axis) of a ScatterChart, controlling linear or logarithmic scaling, bounds, ticks, gridlines, and formatting.
class Axis:
    def __init__(
        self,
        scale: ScaleType = "linear",
        min_value: float | None = None,
        max_value: float | None = None,
        ticks: list[float] | None = None,
        tick_step: float | None = None,
        format: FormatterType = None,
        unit: str = "",
        label: str = "",
        show_grid: bool = True,
        grid_style: Style | None = None,
        show_axis_line: bool = True,
        line_style: Style | None = None,
        show_ticks: bool = True,
        tick_label_style: Style | None = None,
        label_style: Style | None = None,
    ) -> None: ...
Parameters#
| Parameter | Type | Default | Description |
|---|---|---|---|
scale |
ScaleType |
"linear" |
Linear nice-number scaling ("linear") or base-10 logarithmic scaling ("log"). |
min_value |
float | None |
None |
Explicit minimum axis domain bound. Auto-computed when None. |
max_value |
float | None |
None |
Explicit maximum axis domain bound. Auto-computed when None. |
ticks |
list[float] | None |
None |
Explicit tick positions overriding automatic tick generation. |
tick_step |
float | None |
None |
Explicit linear interval step between adjacent ticks. |
format |
str | Callable[[float], str] | None |
None |
Format string or callable for axis tick labels. |
unit |
str |
"" |
Unit suffix appended to formatted tick labels (e.g. "ms", "GB", " rps"). |
label |
str |
"" |
Descriptive axis title text. |
show_grid |
bool |
True |
Whether to render gridlines along this axis when chart grid_style is set. |
grid_style |
Style | None |
None |
Optional per-axis Style override for gridlines. |
show_axis_line |
bool |
True |
Whether to render the axis baseline stroke. |
line_style |
Style | None |
None |
Optional per-axis Style override for the axis baseline. |
show_ticks |
bool |
True |
Whether to render tick labels along this axis. |
tick_label_style |
Style | None |
None |
Optional per-axis Style override for tick labels. |
label_style |
Style | None |
None |
Optional Style override for the axis label title. |
Methods#
configure
def configure(
    self,
    scale: ScaleType | None = None,
    min_value: float | None = None,
    max_value: float | None = None,
    ticks: list[float] | None = None,
    tick_step: float | None = None,
    format: FormatterType = None,
    unit: str | None = None,
    label: str | None = None,
    show_grid: bool | None = None,
    grid_style: Style | None = None,
    show_axis_line: bool | None = None,
    line_style: Style | None = None,
    show_ticks: bool | None = None,
    tick_label_style: Style | None = None,
    label_style: Style | None = None,
) -> None
Updates multiple axis configuration options in place.
format_value
def format_value(self, value: float) -> str
Formats a numeric value into a display label string using format and unit.
typeDrawDirection#
Spatial partial-rendering direction used with Series.draw_ratio (0.0 to 1.0) for progressive scatter and bubble animations.
DrawDirection = Literal["bottom_to_top", "left_to_right"]
| Literal Value | ScatterChart Behavior |
|---|---|
"left_to_right" |
Reveals series points progressively from left to right across the X-axis range (default). |
"bottom_to_top" |
Raises series points vertically from the bottom baseline toward target y while scaling marker radius by radius * draw_ratio. |
typeLegendPosition#
Literal type representing preset legend placement identifiers.
LegendPosition = Literal["top", "bottom", "right", "none", "auto"]
- Note:
ScatterChartplaces legends explicitly on the canvas viaScatterChart.draw_legend().
classPoint#
Mutable data model representing a single (x, y) data point in a ScatterChart, either registered standalone via ScatterChart.add() or inside a Series.
- Data Coordinate:
xyspecifies the point's(x, y)values in chart data coordinates (mapped onto the canvas throughx_axisandy_axis).
class Point:
    def __init__(
        self,
        xy: tuple[float, float],
        style: Style,
        radius: float = 1.0,
        shape: PointShape = "circle",
        label: str = "",
        label_style: Style | None = None,
        *,
        show: bool = True,
    ) -> None: ...
Parameters & Attributes#
| Parameter / Attribute | Type | Default | Description |
|---|---|---|---|
xy |
tuple[float, float] |
Required | Continuous (x, y) data coordinates along x_axis and y_axis. |
style |
Style |
Required | Marker fill and stroke Style. |
radius |
float |
1.0 |
Marker radius (or half-width) in canvas units. |
shape |
PointShape |
"circle" |
Marker geometry ("circle", "square", "rhombus", "triangle", "none"). |
label |
str |
"" |
Optional annotation text rendered adjacent to the point. |
label_style |
Style | None |
None |
Custom text style for label (falls back to ScatterChart.value_text_style when None). |
show |
bool |
True |
Toggles point visibility while preserving automatic X/Y axis domain bounds. |
typePointShape#
Literal type specifying the geometric marker shape for scatter and bubble points.
PointShape = Literal["circle", "square", "rhombus", "triangle", "none"]
| Literal Value | Description |
|---|---|
"circle" |
Circular point or bubble marker (default). |
"square" |
Axis-aligned square marker. |
"rhombus" |
Rotated diamond (45°) marker. |
"triangle" |
Upward-pointing equilateral triangle marker. |
"none" |
Suppresses marker geometry (useful for text-only callout annotations via add(..., shape="none", label="...")). |
typeScaleType#
Literal type controlling the coordinate mapping algorithm on Axis (configure_x_axis / configure_y_axis).
ScaleType = Literal["linear", "log"]
| Literal Value | Description |
|---|---|
"linear" |
Standard arithmetic linear scaling with nice-number tick intervals ($1, 2, 5 \times 10^k$) (default). |
"log" |
Base-10 logarithmic ($\log_{10}$) scaling for multi-order-of-magnitude domains (requires strictly positive values). |
classScatterChart#
2D scatter and bubble chart builder with dual continuous numerical X and Y axes.
- Coordinate Anchor: Bottom-Left
(x0, y0)by default indraw(xy=..., align="bottom_left"), or geometric center whenalign="center".
class ScatterChart:
    def __init__(
        self,
        *,
        axis_line_style: Style,
        width: float = 88.0,
        height: float = 55.0,
        default_radius: float = 1.0,
        default_shape: PointShape = "circle",
        axis_text_style: Style | None = None,
        grid_style: Style | None = None,
        value_text_style: Style | None = None,
        background_style: Style | None = None,
        title: str = "",
        title_style: Style | None = None,
    ) -> None: ...
Parameters#
| Parameter | Type | Default | Description |
|---|---|---|---|
axis_line_style |
Style |
Required | Mandatory style for the X and Y coordinate axes baselines and ticks. |
width |
float |
88.0 |
Overall chart bounding box width in canvas units. |
height |
float |
55.0 |
Overall chart bounding box height in canvas units. |
default_radius |
float |
1.0 |
Default marker radius in canvas units when radius is omitted in add() or add_series(). |
default_shape |
PointShape |
"circle" |
Default marker shape when shape is omitted in add() or add_series(). |
axis_text_style |
Style | None |
None |
Style for X/Y tick labels and axis titles. Omitted when None. |
grid_style |
Style | None |
None |
Style for horizontal and vertical Cartesian gridlines. Omitted when None. |
value_text_style |
Style | None |
None |
Default typography style for Point.label annotations when label_style is None. |
background_style |
Style | None |
None |
Outer chart background card style. Omitted when None. |
title |
str |
"" |
Chart title text displayed at the top of the container. |
title_style |
Style | None |
None |
Typography style required to render title. Omitted when None. |
Methods & Properties#
add
def add(
    self,
    xy: tuple[float, float],
    style: Style,
    radius: float | None = None,
    shape: PointShape | None = None,
    label: str = "",
    label_style: Style | None = None,
    *,
    show: bool = True,
) -> Point
Adds a single standalone (x, y) data point with an optional label callout and returns the mutable Point instance. Standalone points do not appear in draw_legend().
add_series
def add_series(
    self,
    name: str,
    data: list[tuple[float, float]] | list[tuple[float, float, float]],
    style: Style,
    radius: float | None = None,
    shape: PointShape | None = None,
    legend_text_style: Style | None = None,
    *,
    show: bool = True,
    draw_ratio: float = 1.0,
    draw_direction: DrawDirection = "left_to_right",
) -> Series
Adds a named group of 2-tuple (x, y) scatter points or 3-tuple (x, y, radius) bubble points and returns the mutable Series instance.
configure_x_axis
def configure_x_axis(
    self,
    scale: ScaleType | None = None,
    min_value: float | None = None,
    max_value: float | None = None,
    ticks: list[float] | None = None,
    tick_step: float | None = None,
    format: FormatterType = None,
    unit: str | None = None,
    label: str | None = None,
    show_grid: bool | None = None,
    grid_style: Style | None = None,
    show_axis_line: bool | None = None,
    line_style: Style | None = None,
    show_ticks: bool | None = None,
    tick_label_style: Style | None = None,
) -> Axis
Configures continuous horizontal X-axis parameters in a single call and returns x_axis.
configure_y_axis
def configure_y_axis(
    self,
    scale: ScaleType | None = None,
    min_value: float | None = None,
    max_value: float | None = None,
    ticks: list[float] | None = None,
    tick_step: float | None = None,
    format: FormatterType = None,
    unit: str | None = None,
    label: str | None = None,
    show_grid: bool | None = None,
    grid_style: Style | None = None,
    show_axis_line: bool | None = None,
    line_style: Style | None = None,
    show_ticks: bool | None = None,
    tick_label_style: Style | None = None,
) -> Axis
Configures continuous vertical Y-axis parameters in a single call and returns y_axis.
draw
def draw(
    self,
    xy: tuple[float, float] = (0.0, 0.0),
    *,
    width: float | None = None,
    height: float | None = None,
    align: Literal["bottom_left", "center"] = "bottom_left",
    scale: float = 1.0,
) -> None
Renders the scatter chart onto the canvas anchored at xy (Bottom-Left (x0, y0) by default, or geometric center when align="center").
draw_legend
def draw_legend(
    self,
    xy: tuple[float, float],
    text_style: Style,
    orientation: Orientation = "vertical",
    swatch_width: float = 2.4,
    swatch_height: float = 1.2,
    item_gap: float = 4.0,
    *,
    scale: float = 1.0,
) -> None
Renders a standalone legend for registered Series at xy ("vertical" or "horizontal").
get_size
def get_size(self) -> tuple[float, float]
Returns (width, height) of the chart container in canvas units.
points *(property)*
@property
def points(self) -> list[Point]
Returns a list copy of standalone Point instances added via add().
series *(property)*
@property
def series(self) -> list[Series]
Returns a list copy of named Series instances added via add_series().
classSeries#
Mutable data model representing a named group of scatter or bubble points in a ScatterChart.
class Series:
    def __init__(
        self,
        name: str,
        points: list[Point],
        style: Style,
        radius: float = 1.0,
        shape: PointShape = "circle",
        legend_text_style: Style | None = None,
        *,
        show: bool = True,
        draw_ratio: float = 1.0,
        draw_direction: DrawDirection = "left_to_right",
    ) -> None: ...
Parameters & Attributes#
| Parameter / Attribute | Type | Default | Description |
|---|---|---|---|
name |
str |
Required | Series display name shown in draw_legend(). |
points |
list[Point] |
Required | Member Point instances belonging to this series. |
style |
Style |
Required | Default marker fill and stroke Style for the series. |
radius |
float |
1.0 |
Series-level marker radius in canvas units (shown as swatch reference). |
shape |
PointShape |
"circle" |
Series-level marker geometry. |
legend_text_style |
Style | None |
None |
Optional custom text style for this series in draw_legend(). |
show |
bool |
True |
Toggles series visibility while preserving automatic X/Y axis domain bounds. |
draw_ratio |
float |
1.0 |
Spatial rendering progress (0.0 to 1.0) for animations. |
draw_direction |
DrawDirection |
"left_to_right" |
Partial rendering direction ("left_to_right" or "bottom_to_top"). |