drawlib.charts.pie
2D pie and donut chart builder supporting exploded slices, inner donut hole KPI badges (center_text), automatic narrow-wedge label suppression (< 4%), and decoupled legends. Import from drawlib.charts.pie (from drawlib.charts.pie import PieChart, Slice).
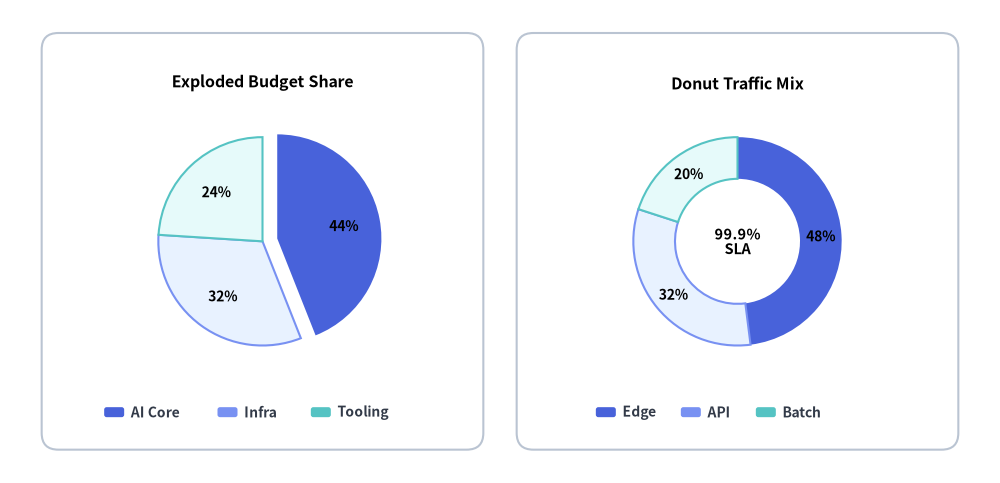
Source Code
from drawlib.canvas import save, setup
from drawlib.charts.pie import PieChart
from drawlib.shapes import rectangle
from drawlib.styles import Colors, Styles

setup(width=120, height=58)

card_style = Styles.Neutral.patch(shape_r=2.0, shape_line_color=Colors.Gray4, shape_fill_color=Colors.White)
rectangle((31.5, 29.0), width=53.0, height=50.0, style=card_style)
rectangle((88.5, 29.0), width=53.0, height=50.0, style=card_style)

# Left: Solid Exploded PieChart
solid = PieChart(
    radius=12.5,
    width=48.0,
    height=37.0,
    hole_ratio=0.0,
    title="Exploded Budget Share",
    title_style=Styles.BlackBold.patch(text_size=11.5),
    value_text_style=Styles.BlackBold.patch(text_size=10.0),
    value_format="{:.0f}%",
)
solid.add_slice("AI Core", 44.0, style=Styles.PrimaryFlat, explode=1.8)
solid.add_slice("Infra", 32.0, style=Styles.PrimaryNeutral)
solid.add_slice("Tooling", 24.0, style=Styles.SecondaryNeutral)
solid.draw(xy=(7.5, 13.5))
solid.draw_legend(xy=(12.5, 8.5), text_style=Styles.DarkBold.patch(text_size=10.0), orientation="horizontal", item_gap=2.0)

# Right: Donut PieChart with Center KPI Badge
donut = PieChart(
    radius=12.5,
    width=48.0,
    height=37.0,
    hole_ratio=0.60,
    center_text="99.9%\nSLA",
    center_text_style=Styles.BlackBold.patch(text_size=10.5),
    title="Donut Traffic Mix",
    title_style=Styles.BlackBold.patch(text_size=11.5),
    value_text_style=Styles.BlackBold.patch(text_size=10.0),
    value_format="{:.0f}%",
)
donut.add_slice("Edge", 48.0, style=Styles.PrimaryFlat)
donut.add_slice("API", 32.0, style=Styles.PrimaryNeutral)
donut.add_slice("Batch", 20.0, style=Styles.SecondaryNeutral)
donut.draw(xy=(64.5, 13.5))
donut.draw_legend(xy=(71.5, 8.5), text_style=Styles.DarkBold.patch(text_size=10.0), orientation="horizontal", item_gap=2.2)

save()
typeDrawDirection#
Spatial partial-rendering direction used with Slice.draw_ratio (0.0 to 1.0) for progressive pie and donut animations.
DrawDirection = Literal["bottom_to_top", "left_to_right"]
| Literal Value | PieChart Behavior |
|---|---|
"left_to_right" |
Sweeps each wedge angularly from its starting angle across sweep_angle * draw_ratio (inline labels appear once draw_ratio >= 0.6) (default). |
"bottom_to_top" |
Expands each wedge radially outward from the inner hole (hole_ratio) toward outer radius. |
typeFormatterType#
Union type controlling inline percentage label formatting (PieChart.value_format).
FormatterType = str | Callable[[float], str] | None
str: Python format string receiving the slice's percentage share in0.0–100.0(defaults to"{:.1f}%").Callable[[float], str]: Custom formatter callable accepting the percentagefloatand returning a display string (e.g.lambda pct: f"{pct:.0f}%").None: Uses compact numeric percentage formatting.
classPieChart#
2D proportional pie or donut chart builder where slices represent parts of a $100%$ whole.
- Coordinate Anchor: Bottom-Left
(x0, y0)by default indraw(xy=..., align="bottom_left"), or geometric center whenalign="center". - Narrow Wedge Protection: Inline labels (
value_text_style) are automatically omitted on slices representing less than $4%$ of the total sum to prevent label collisions.
class PieChart:
    def __init__(
        self,
        *,
        radius: float = 20.0,
        hole_ratio: float = 0.0,
        start_angle: float = 90.0,
        clockwise: bool = True,
        value_text_style: Style | None = None,
        value_format: FormatterType = "{:.1f}%",
        center_text: str = "",
        center_text_style: Style | None = None,
        background_style: Style | None = None,
        title: str = "",
        title_style: Style | None = None,
        width: float | None = None,
        height: float | None = None,
    ) -> None: ...
Parameters#
| Parameter | Type | Default | Description |
|---|---|---|---|
radius |
float |
20.0 |
Outer radius of the pie or donut ring in canvas units. |
hole_ratio |
float |
0.0 |
Inner hole radius ratio (0.0 for solid pie; 0.1 to 0.9 for donut ring). |
start_angle |
float |
90.0 |
Initial radial angle in degrees (90.0 is 12 o'clock, 0.0 is 3 o'clock). |
clockwise |
bool |
True |
Advances slices clockwise when True, or counter-clockwise when False. |
value_text_style |
Style | None |
None |
Typography style for inline slice percentage labels ($\ge 4%$ share). Omitted when None. |
value_format |
FormatterType |
"{:.1f}%" |
Format string or callable receiving slice percentage (0.0–100.0). |
center_text |
str |
"" |
KPI text rendered inside the donut hole (supports \n; requires hole_ratio > 0). |
center_text_style |
Style | None |
None |
Typography style required to render center_text. Omitted when None. |
background_style |
Style | None |
None |
Outer chart background card style. Omitted when None. |
title |
str |
"" |
Chart title text displayed at the top of the container. |
title_style |
Style | None |
None |
Typography style required to render title. Omitted when None. |
width |
float | None |
None |
Explicit container width override. Computed from radius and title when None. |
height |
float | None |
None |
Explicit container height override. Computed from radius and title when None. |
Methods & Properties#
add_slice
def add_slice(
    self,
    name: str,
    value: float,
    style: Style,
    explode: float = 0.0,
    legend_text_style: Style | None = None,
    *,
    show: bool = True,
    draw_ratio: float = 1.0,
    draw_direction: DrawDirection = "left_to_right",
) -> Slice
Adds a proportional slice wedge to the chart and returns the mutable Slice instance. explode > 0.0 offsets the wedge radially outward along its bisector angle.
draw
def draw(
    self,
    xy: tuple[float, float] = (0.0, 0.0),
    *,
    radius: float | None = None,
    width: float | None = None,
    height: float | None = None,
    align: Literal["bottom_left", "center"] = "bottom_left",
    scale: float = 1.0,
) -> None
Renders the pie or donut chart onto the canvas anchored at xy (Bottom-Left (x0, y0) by default, or geometric center when align="center"), with optional one-call radius, width, height, and scale overrides.
draw_legend
def draw_legend(
    self,
    xy: tuple[float, float],
    text_style: Style,
    orientation: Literal["vertical", "horizontal"] = "vertical",
    swatch_width: float = 2.4,
    swatch_height: float = 1.2,
    item_gap: float = 4.0,
    *,
    scale: float = 1.0,
) -> None
Renders a standalone slice legend at xy ("vertical" or "horizontal").
get_size
def get_size(self) -> tuple[float, float]
Computes and returns the total (width, height) bounding box dimensions of the radial chart container.
slices *(property)*
@property
def slices(self) -> list[Slice]
Returns a list copy of Slice instances registered with this chart.
classSlice#
Mutable data model representing a single proportional wedge in a PieChart.
class Slice:
    def __init__(
        self,
        name: str,
        value: float,
        style: Style,
        explode: float = 0.0,
        legend_text_style: Style | None = None,
        show: bool = True,
        draw_ratio: float = 1.0,
        draw_direction: DrawDirection = "left_to_right",
    ) -> None: ...
Parameters & Attributes#
| Parameter / Attribute | Type | Default | Description |
|---|---|---|---|
name |
str |
Required | Slice display label shown in draw_legend(). |
value |
float |
Required | Non-negative numerical magnitude determining angular wedge share. |
style |
Style |
Required | Wedge fill and border Style. |
explode |
float |
0.0 |
Outward radial offset distance from center in canvas units (0.0 = flush). |
legend_text_style |
Style | None |
None |
Optional custom text style for this slice in draw_legend(). |
show |
bool |
True |
Toggles wedge visibility while preserving the 100% sum across all registered slices. |
draw_ratio |
float |
1.0 |
Spatial rendering progress (0.0 to 1.0) for animations. |
draw_direction |
DrawDirection |
"left_to_right" |
Partial rendering direction ("left_to_right" angular sweep or "bottom_to_top" radial growth). |