drawlib.canvas
drawlib.canvas manages the Cartesian drawing surface (origin (0, 0) at bottom-left; X right, Y up), resolution (dpi), coordinate grids, and output export lifecycle. Import lifecycle functions via from drawlib.canvas import canvas, clear, get_dimage, save, setup, show.
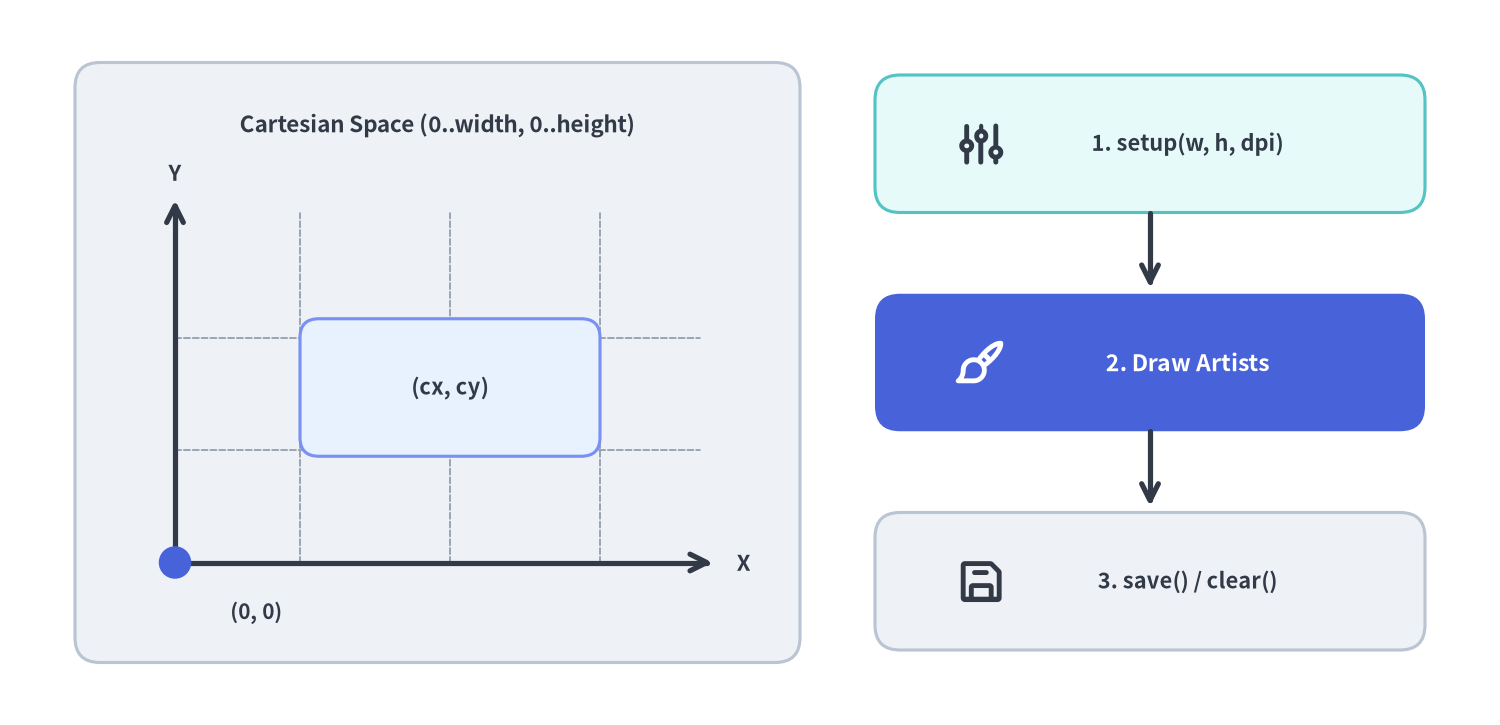
Source Code
from drawlib.canvas import save, setup
from drawlib.icons import phosphor
from drawlib.lines import line
from drawlib.shapes import circle, rectangle
from drawlib.styles import Colors, Styles
from drawlib.text import text

setup(width=120, height=58, dpi=150)

# Left panel: Cartesian coordinate space
rectangle((35, 29), width=58, height=48, style=Styles.Neutral.patch(shape_r=2.0))
text(
    (35, 48.0),
    "Cartesian Space (0..width, 0..height)",
    style=Styles.DarkBold.patch(text_size=10.8),
)

# Subtle internal coordinate grid
for gx in (24, 36, 48):
    line((gx, 13), (gx, 41), style=Styles.MutedDashed.patch(line_width=0.8))
for gy in (22, 31):
    line((14, gy), (56, gy), style=Styles.MutedDashed.patch(line_width=0.8))

# X and Y axes from bottom-left origin (14, 13)
line((14, 13), (57, 13), arrow_head="->", style=Styles.DarkBold)
line((14, 13), (14, 42), arrow_head="->", style=Styles.DarkBold)
circle((14, 13), radius=1.3, style=Styles.PrimaryFlat)
text((20.5, 9.0), "(0, 0)", style=Styles.DarkBold.patch(text_size=10.0))
text((59.5, 13.0), "X", style=Styles.DarkBold.patch(text_size=10.5))
text((14.0, 44.2), "Y", style=Styles.DarkBold.patch(text_size=10.5))

# Center-anchored shape inside coordinate space
rectangle(
    (36, 27),
    width=24,
    height=11,
    style=Styles.PrimaryNeutral.patch(shape_r=1.5),
    text="(cx, cy)",
    text_style=Styles.DarkBold.patch(text_size=10.5),
)

# Right panel: 3-stage Canvas lifecycle
rectangle((92, 46.5), width=44, height=11, style=Styles.SecondaryNeutral.patch(shape_r=2.0))
phosphor.sliders((78.5, 46.5), width=4.0, style=Styles.DarkBold)
text((95.0, 46.5), "1. setup(w, h, dpi)", style=Styles.DarkBold.patch(text_size=10.5))

line((92, 41.0), (92, 35.0), arrow_head="->", style=Styles.DarkBold)

rectangle((92, 29.0), width=44, height=11, style=Styles.PrimaryFlat.patch(shape_r=2.0))
phosphor.paint_brush((78.5, 29.0), width=4.0, style=Styles.WhiteBold)
text(
    (95.0, 29.0),
    "2. Draw Artists",
    style=Styles.WhiteBold.patch(text_size=11.0, text_color=Colors.White),
)

line((92, 23.5), (92, 17.5), arrow_head="->", style=Styles.DarkBold)

rectangle((92, 11.5), width=44, height=11, style=Styles.Neutral.patch(shape_r=2.0))
phosphor.floppy_disk((78.5, 11.5), width=4.0, style=Styles.DarkBold)
text((95.0, 11.5), "3. save() / clear()", style=Styles.DarkBold.patch(text_size=10.5))

save()
constcanvas#
Singleton Canvas engine instance backing all module-level drawing and lifecycle functions. In addition to mirroring setup(), clear(), save(), show(), get_dimage(), and all 54 shape/line/text/image drawing methods, canvas exposes scoped coordinate transformations via canvas.transform(...) and typography metric helpers.
from drawlib.canvas import canvas

# Scoped coordinate scaling and translation context manager:
with canvas.transform(origin=(0.0, 0.0), scale=0.9, translate=(10.0, 5.0)):
    ...
Public Methods & Constants on Canvas#
| Method / Attribute | Signature / Value | Description |
|---|---|---|
canvas.transform |
(origin: Coordinate = (0.0, 0.0), scale: float = 1.0, translate: tuple[float, float] = (0.0, 0.0)) -> Generator[None, None, None] |
Context manager that scales (> 0) around origin and shifts by translate all artists added inside its with block. |
canvas.get_charwidth_from_fontsize |
(size: PosFloat) -> float |
Estimate logical character width in canvas units from a font size in points. |
canvas.get_fontsize_from_charwidth |
(width: PosFloat) -> float |
Estimate font size in points required to match a target logical character width. |
canvas.setup |
(width=None, height=None, dpi=None, ...) -> None |
Configure canvas dimensions, background, DPI, and coordinate grid (same as setup()). |
canvas.clear |
() -> None |
Clear all registered artists and reset canvas configuration to defaults (same as clear()). |
canvas.save |
(file=None, format=None) -> None |
Render and save the canvas to disk (same as save()). |
canvas.get_dimage |
() -> Dimage |
Render the canvas in memory and return a Dimage (same as get_dimage()). |
canvas.show |
() -> None |
Display the canvas in an interactive Matplotlib window (same as show()). |
DEFAULT_WIDTH / DEFAULT_HEIGHT / DEFAULT_DPI |
100 / 100 / 100 |
Default logical width, logical height, and output DPI. |
FIGURE_WIDTH_INCHES / POINTS_PER_INCH |
10.0 / 72.0 |
Fixed physical figure width (720 pt) used for deterministic typography scaling across canvas widths. |
defclear()#
Reset the active canvas state, removing all registered drawing artists and restoring default geometry, background, DPI, and grid parameters. Always call clear() between consecutive drawings in multi-image Python scripts.
def clear() -> None
| Parameter | Type | Default | Description |
|---|---|---|---|
| (none) | — | — | Takes no arguments and returns None. |
defget_dimage()#
Render all artists currently registered on the canvas in memory and return an immutable Dimage object without writing to disk. Does not automatically clear the canvas.
def get_dimage() -> Dimage
| Return Type | Description |
|---|---|
Dimage |
Rendered RGBA/RGB canvas image wrapped in a Dimage instance for post-processing or composition. |
defsave(file=None, format=None)#
Render the current canvas illustration and write it to an image file on disk. Inside Markdown ```drawlib blocks, drawlib build captures the canvas automatically and safely treats explicit save() calls as a no-op so code snippets remain copy-paste compatible with standalone .py scripts.
def save(
    file: str | None = None,
    format: ImageFormat | None = None,
) -> None
| Parameter | Type | Default | Description |
|---|---|---|---|
file |
str | None |
None |
Output file path. When None, defaults to "<caller_script_stem>.png" in the caller script's directory. |
format |
Literal["png", "jpg", "jpeg", "webp", "pdf"] | None |
None |
Explicit output format. Inferred from file extension when omitted, falling back to "png". |
defsetup(width=None, height=None, dpi=None, ...)#
Configure canvas logical coordinate bounds (0..width horizontally, 0..height vertically from bottom-left (0, 0)), rasterization dpi, background color/opacity, and optional coordinate inspection grid. Must be called before registering drawing artists (calling setup() after drawing raises RuntimeError; call clear() first to reconfigure).
def setup(
    width: PosInt | None = None,
    height: PosInt | None = None,
    dpi: PosInt | None = None,
    color: ColorType | None = None,
    alpha: Alpha | None = None,
    background_color: ColorType | None = None,
    background_alpha: Alpha | None = None,
    grid: bool | None = None,
    grid_only: bool | None = None,
    grid_style: Style | None = None,
    grid_centerstyle: Style | None = None,
    grid_xpitch: PosInt | None = None,
    grid_ypitch: PosInt | None = None,
) -> None
| Parameter | Type | Default | Description |
|---|---|---|---|
width |
PosInt | None |
100 |
Logical canvas width along the X-axis (> 0). |
height |
PosInt | None |
100 |
Logical canvas height along the Y-axis (> 0). |
dpi |
PosInt | None |
100 |
Output resolution in dots per inch (since figure width is 10.0 in, pixel width is 10 * dpi). |
color |
ColorType | None |
(255, 255, 255) |
Canvas background color (Color, RGB/RGBA tuple, hex string, or CSS color name). |
alpha |
Alpha | None |
1.0 |
Canvas background opacity in [0.0, 1.0] (0.0 produces a transparent PNG/WebP background). |
background_color |
ColorType | None |
None |
Explicit alias for color. |
background_alpha |
Alpha | None |
None |
Explicit alias for alpha. |
grid |
bool | None |
False |
Overlay coordinate grid lines and axis tick labels for geometry verification. |
grid_only |
bool | None |
False |
Render only the coordinate grid without user artists. |
grid_style |
Style | None |
Gray dashed | Line Style applied to regular grid intervals. |
grid_centerstyle |
Style | None |
Bold gray dashed | Line Style applied to center axes (x = width / 2, y = height / 2). |
grid_xpitch |
PosInt | None |
10 (or width // 10) |
Horizontal spacing between vertical grid lines. |
grid_ypitch |
PosInt | None |
10 (or height // 10) |
Vertical spacing between horizontal grid lines. |
defshow()#
Open an interactive local desktop Matplotlib preview window displaying the current canvas illustration. For headless CLI/CI environments, use save() or drawlib show <file> -o preview.png instead.
def show() -> None
| Parameter | Type | Default | Description |
|---|---|---|---|
| (none) | — | — | Takes no arguments and returns None. |