drawlib.charts.box
Statistical box plot, 1D/jittered strip plot, and hybrid distribution overlay builder supporting grouped multi-series categories, pre-aggregated BoxStats summaries, Tukey IQR / min-max / percentile whiskers, mean and outlier markers, logarithmic axes, and partial animation reveal. Import from drawlib.charts.box (from drawlib.charts.box import Axis, BoxChart, BoxStats, Series).
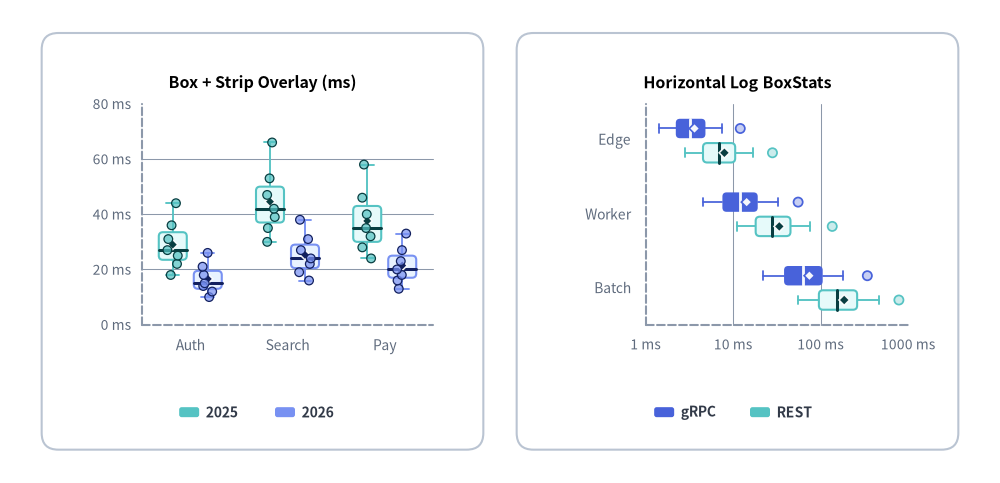
Source Code
from drawlib.canvas import save, setup
from drawlib.charts.box import BoxChart, BoxStats
from drawlib.shapes import rectangle
from drawlib.styles import Colors, Styles

setup(width=120, height=58)

card_style = Styles.Neutral.patch(shape_r=2.0, shape_line_color=Colors.Gray4, shape_fill_color=Colors.White)
rectangle((31.5, 29.0), width=53.0, height=50.0, style=card_style)
rectangle((88.5, 29.0), width=53.0, height=50.0, style=card_style)

# Left: Vertical Box + Strip Overlay from Raw Samples
v_box = BoxChart(
    axis_line_style=Styles.MutedDashed,
    categories=["Auth", "Search", "Pay"],
    width=48.0,
    height=37.0,
    orientation="vertical",
    show_box=True,
    show_points=True,
    show_mean=True,
    box_width_ratio=0.72,
    box_r=0.5,
    jitter=0.42,
    point_radius=0.52,
    axis_text_style=Styles.Muted.patch(text_size=10.0),
    grid_style=Styles.MutedThin,
    title="Box + Strip Overlay (ms)",
    title_style=Styles.BlackBold.patch(text_size=11.5),
)
v_box.configure_y_axis(min_value=0.0, max_value=80.0, tick_step=20.0, unit="ms")
v_box.add_series(
    "2025",
    [
        [18.0, 22.0, 25.0, 27.0, 31.0, 36.0, 44.0],
        [30.0, 35.0, 39.0, 42.0, 47.0, 53.0, 66.0],
        [24.0, 28.0, 32.0, 35.0, 40.0, 46.0, 58.0],
    ],
    style=Styles.SecondaryNeutral,
)
v_box.add_series(
    "2026",
    [
        [10.0, 12.0, 14.0, 15.0, 18.0, 21.0, 26.0],
        [16.0, 19.0, 22.0, 24.0, 27.0, 31.0, 38.0],
        [13.0, 16.0, 18.0, 20.0, 23.0, 27.0, 33.0],
    ],
    style=Styles.PrimaryNeutral,
)
v_box.draw(xy=(7.5, 13.5))
v_box.draw_legend(xy=(21.5, 8.5), text_style=Styles.DarkBold.patch(text_size=10.0), orientation="horizontal", item_gap=3.5)

# Right: Horizontal Logarithmic BoxChart from Pre-Aggregated BoxStats
h_box = BoxChart(
    axis_line_style=Styles.MutedDashed,
    categories=["Edge", "Worker", "Batch"],
    width=48.0,
    height=37.0,
    orientation="horizontal",
    show_outliers=True,
    show_mean=True,
    box_width_ratio=0.66,
    box_r=0.5,
    point_radius=0.55,
    axis_text_style=Styles.Muted.patch(text_size=10.0),
    grid_style=Styles.MutedThin,
    title="Horizontal Log BoxStats",
    title_style=Styles.BlackBold.patch(text_size=11.5),
)
h_box.configure_x_axis(scale="log", min_value=1.0, max_value=1000.0, ticks=[1.0, 10.0, 100.0, 1000.0], unit="ms")
h_box.add_series(
    "gRPC",
    [
        BoxStats(min=1.4, q1=2.2, median=3.2, q3=4.8, max=7.5, mean=3.6, outliers=[12.0]),
        BoxStats(min=4.5, q1=7.5, median=12.0, q3=19.0, max=32.0, mean=14.2, outliers=[55.0]),
        BoxStats(min=22.0, q1=38.0, median=62.0, q3=105.0, max=180.0, mean=74.0, outliers=[340.0]),
    ],
    style=Styles.PrimaryFlat,
)
h_box.add_series(
    "REST",
    [
        BoxStats(min=2.8, q1=4.5, median=6.8, q3=10.5, max=17.0, mean=7.9, outliers=[28.0]),
        BoxStats(min=11.0, q1=18.0, median=28.0, q3=45.0, max=76.0, mean=33.5, outliers=[135.0]),
        BoxStats(min=55.0, q1=95.0, median=155.0, q3=260.0, max=460.0, mean=185.0, outliers=[780.0]),
    ],
    style=Styles.SecondaryNeutral,
)
h_box.draw(xy=(64.5, 13.5))
h_box.draw_legend(xy=(78.5, 8.5), text_style=Styles.DarkBold.patch(text_size=10.0), orientation="horizontal", item_gap=3.5)

save()
classAxis#
Represents a Cartesian coordinate axis (numerical value axis or categorical axis) shared across BoxChart, BarChart, LineChart, AreaChart, and ScatterChart. Controls linear or logarithmic scaling, domain bounds, tick generation, gridline visibility, and tick value formatting.
class Axis:
    def __init__(
        self,
        scale: ScaleType = "linear",
        min_value: float | None = None,
        max_value: float | None = None,
        ticks: list[float] | None = None,
        tick_step: float | None = None,
        format: FormatterType = None,
        unit: str = "",
        label: str = "",
        show_grid: bool = True,
        grid_style: Style | None = None,
        show_axis_line: bool = True,
        line_style: Style | None = None,
        show_ticks: bool = True,
        tick_label_style: Style | None = None,
        label_style: Style | None = None,
    ) -> None: ...
Parameters#
| Parameter | Type | Default | Description |
|---|---|---|---|
scale |
ScaleType |
"linear" |
Nice-numbers linear scaling ("linear") or base-10 logarithmic scaling ("log"). |
min_value |
float | None |
None |
Explicit minimum axis domain bound. Auto-computed when None. |
max_value |
float | None |
None |
Explicit maximum axis domain bound. Auto-computed when None. |
ticks |
list[float] | None |
None |
Explicit tick positions overriding automatic tick generation. |
tick_step |
float | None |
None |
Explicit linear interval step between adjacent ticks. |
format |
FormatterType |
None |
Format string (e.g. "{:.1f}ms", "${:,.0f}") or callable Callable[[float], str] for tick labels. |
unit |
str |
"" |
Unit suffix appended to formatted tick labels if not already present (e.g. "ms", "%"). |
label |
str |
"" |
Descriptive axis title text. |
show_grid |
bool |
True |
Whether to render gridlines along this axis when chart grid_style is set. |
grid_style |
Style | None |
None |
Optional per-axis Style override for gridlines. |
show_axis_line |
bool |
True |
Whether to render the axis baseline stroke. |
line_style |
Style | None |
None |
Optional per-axis Style override for the axis baseline. |
show_ticks |
bool |
True |
Whether to render tick labels along this axis. |
tick_label_style |
Style | None |
None |
Optional per-axis Style override for tick labels. |
label_style |
Style | None |
None |
Optional Style override for the axis label title. |
Methods#
configure
def configure(
    self,
    scale: ScaleType | None = None,
    min_value: float | None = None,
    max_value: float | None = None,
    ticks: list[float] | None = None,
    tick_step: float | None = None,
    format: FormatterType = None,
    unit: str | None = None,
    label: str | None = None,
    show_grid: bool | None = None,
    grid_style: Style | None = None,
    show_axis_line: bool | None = None,
    line_style: Style | None = None,
    show_ticks: bool | None = None,
    tick_label_style: Style | None = None,
    label_style: Style | None = None,
) -> None
Updates any non-None axis configuration attributes in place.
format_value
def format_value(self, value: float) -> str
Formats value into a display string using format (string template, callable, or compact numeric default) and appends unit when configured.
classBoxChart#
Configurable container and fluent builder for statistical box plots, 1D or jittered strip plots, and hybrid box-and-strip distribution overlays across grouped multi-series categories.
- Coordinate Anchor: Bottom-Left
(x0, y0)by default indraw(xy=..., align="bottom_left"), or geometric center whenalign="center". - Visibility Rule: At least one of
show_boxorshow_pointsmust beTrue(on both chart defaults and per-series overrides).
class BoxChart:
    def __init__(
        self,
        *,
        axis_line_style: Style,
        width: float = 68.0,
        height: float = 44.0,
        categories: list[str] | None = None,
        orientation: Orientation = "vertical",
        show_box: bool = True,
        show_points: bool = False,
        show_outliers: bool = True,
        show_mean: bool = False,
        whisker_mode: WhiskerMode = "iqr",
        iqr_k: float = 1.5,
        whisker_percentiles: tuple[float, float] = (5.0, 95.0),
        box_width_ratio: float = 0.65,
        cap_width_ratio: float = 0.45,
        box_r: float = 0.0,
        jitter: float = 0.45,
        jitter_seed: int = 42,
        point_radius: float = 0.58,
        point_shape: PointShape = "circle",
        outlier_shape: PointShape = "circle",
        mean_shape: PointShape = "rhombus",
        axis_text_style: Style | None = None,
        grid_style: Style | None = None,
        value_text_style: Style | None = None,
        value_format: FormatterType = None,
        background_style: Style | None = None,
        title: str = "",
        title_style: Style | None = None,
    ) -> None: ...
Parameters#
| Parameter | Type | Default | Description |
|---|---|---|---|
axis_line_style |
Style |
Required | Mandatory style defining baseline coordinate axes. |
width |
float |
68.0 |
Total chart bounding box width in canvas units (> 0.0). |
height |
float |
44.0 |
Total chart bounding box height in canvas units (> 0.0). |
categories |
list[str] | None |
None |
Category names along the categorical axis (x_axis when vertical, y_axis when horizontal). |
orientation |
Orientation |
"vertical" |
Distribution direction ("vertical" along y_axis or "horizontal" along x_axis). |
show_box |
bool |
True |
Default visibility of Q1–Q3 interquartile boxes, whiskers, and median lines. |
show_points |
bool |
False |
Default visibility of individual strip/jitter sample markers. |
show_outliers |
bool |
True |
Default visibility of outlier markers beyond whiskers when show_box=True and show_points=False. |
show_mean |
bool |
False |
Default visibility of arithmetic mean markers. |
whisker_mode |
WhiskerMode |
"iqr" |
Whisker extent calculation rule ("iqr", "min_max", or "percentile") applied to raw sample sequences. |
iqr_k |
float |
1.5 |
Fence multiplier $k \ge 0.0$ applied to $\text{IQR} = Q_3 - Q_1$ when whisker_mode="iqr". |
whisker_percentiles |
tuple[float, float] |
(5.0, 95.0) |
(low_p, high_p) percentiles (0.0 <= low < high <= 100.0) used when whisker_mode="percentile". |
box_width_ratio |
float |
0.65 |
Ratio of each category slot occupied by the series box cluster (0.0 < ratio <= 1.0). |
cap_width_ratio |
float |
0.45 |
Ratio of an individual box's thickness occupied by whisker T-caps (0.0 to 1.0). |
box_r |
float |
0.0 |
Corner rounding radius (>= 0.0) applied to Q1–Q3 boxes when series.style.shape_r is None. |
jitter |
float |
0.45 |
Default normalized transverse spread ratio (0.0 to 1.0) for strip points (0.0 renders an aligned 1D strip). |
jitter_seed |
int |
42 |
Deterministic integer seed producing reproducible per-(series, category) strip point offsets. |
point_radius |
float |
0.58 |
Default marker radius (> 0.0) in canvas units for strip, outlier, and mean points. |
point_shape |
PointShape |
"circle" |
Default marker geometry for strip/jitter sample points. |
outlier_shape |
PointShape |
"circle" |
Marker geometry for outlier points. |
mean_shape |
PointShape |
"rhombus" |
Marker geometry for arithmetic mean points. |
axis_text_style |
Style | None |
None |
Style for tick labels and category names. Omitted when None. |
grid_style |
Style | None |
None |
Style for value-axis gridlines. Omitted when None. |
value_text_style |
Style | None |
None |
Style for inline median value labels placed outside the upper whisker/point tip. Omitted when None. |
value_format |
FormatterType |
None |
Format string (e.g. "{:.1f}ms") or callable for inline median value labels. |
background_style |
Style | None |
None |
Outer chart container card style (shape_fill_color, shape_r). Omitted when None. |
title |
str |
"" |
Chart title text displayed at the top of the container. |
title_style |
Style | None |
None |
Typography style required to render title. Omitted when None. |
Methods & Properties#
add_series
def add_series(
    self,
    name: str,
    data: Sequence[BoxStats | Sequence[float] | None],
    style: Style,
    legend_text_style: Style | None = None,
    *,
    show_box: bool | None = None,
    show_points: bool | None = None,
    show_outliers: bool | None = None,
    show_mean: bool | None = None,
    median_style: Style | None = None,
    whisker_style: Style | None = None,
    point_style: Style | None = None,
    outlier_style: Style | None = None,
    mean_style: Style | None = None,
    point_radius: float | None = None,
    point_shape: PointShape | None = None,
    jitter: float | None = None,
    show: bool = True,
    draw_ratio: float = 1.0,
    draw_direction: DrawDirection | None = None,
) -> Series
Registers a categorical distribution series and returns the mutable Series instance. Each element in data may be a raw Sequence[float] (summarized automatically via BoxStats.from_values() using the chart's whisker_mode, iqr_k, and whisker_percentiles), a pre-aggregated BoxStats object, or None / [] for an empty category slot. Sub-element styles (median_style, whisker_style, point_style, outlier_style, mean_style) auto-derive luminance-aware high-contrast strokes and fills from style when None.
category_axis *(property)*
@property
def category_axis(self) -> Axis
Orientation-aware property returning the categorical Axis (x_axis when orientation="vertical", y_axis when orientation="horizontal").
configure_x_axis
def configure_x_axis(
    self,
    scale: ScaleType | None = None,
    min_value: float | None = None,
    max_value: float | None = None,
    ticks: list[float] | None = None,
    tick_step: float | None = None,
    format: FormatterType = None,
    unit: str | None = None,
    label: str | None = None,
    show_grid: bool | None = None,
    grid_style: Style | None = None,
    show_axis_line: bool | None = None,
    line_style: Style | None = None,
    show_ticks: bool | None = None,
    tick_label_style: Style | None = None,
) -> Axis
Configures horizontal X-axis parameters in a single call and returns the updated Axis.
configure_y_axis
def configure_y_axis(
    self,
    scale: ScaleType | None = None,
    min_value: float | None = None,
    max_value: float | None = None,
    ticks: list[float] | None = None,
    tick_step: float | None = None,
    format: FormatterType = None,
    unit: str | None = None,
    label: str | None = None,
    show_grid: bool | None = None,
    grid_style: Style | None = None,
    show_axis_line: bool | None = None,
    line_style: Style | None = None,
    show_ticks: bool | None = None,
    tick_label_style: Style | None = None,
) -> Axis
Configures vertical Y-axis parameters in a single call and returns the updated Axis.
draw
def draw(
    self,
    xy: tuple[float, float] = (0.0, 0.0),
    *,
    width: float | None = None,
    height: float | None = None,
    align: Literal["bottom_left", "center"] = "bottom_left",
    scale: float = 1.0,
) -> None
Renders the box/strip chart onto the canvas anchored at xy (Bottom-Left (x0, y0) when align="bottom_left", or geometric center when align="center"), with optional temporary dimension overrides and uniform proportional scale.
draw_legend
def draw_legend(
    self,
    xy: tuple[float, float],
    text_style: Style,
    orientation: Orientation = "vertical",
    swatch_width: float = 2.4,
    swatch_height: float = 1.2,
    item_gap: float = 4.0,
    *,
    scale: float = 1.0,
) -> None
Renders a standalone series legend at xy (top-left start when "vertical", middle-left start when "horizontal"). Hidden series (show=False) are automatically excluded.
get_size
def get_size(self) -> tuple[float, float]
Returns (width, height) of the unscaled chart container in canvas units.
series *(property)*
@property
def series(self) -> list[Series]
Returns a list copy of registered Series instances.
value_axis *(property)*
@property
def value_axis(self) -> Axis
Orientation-aware property returning the numerical value Axis (y_axis when orientation="vertical", x_axis when orientation="horizontal").
classBoxStats#
Validated Pydantic BaseModel (extra="forbid") representing summary distribution statistics for a single category slot in a BoxChart. Enforces finite numeric inputs and monotonic quantile order (min <= q1 <= median <= q3 <= max).
class BoxStats(BaseModel):
    min: float
    q1: float
    median: float
    q3: float
    max: float
    mean: float | None = None
    outliers: list[float] = Field(default_factory=list)
    points: list[float] = Field(default_factory=list)
Parameters & Attributes#
| Parameter / Attribute | Type | Default | Description |
|---|---|---|---|
min |
float |
Required | Lower whisker endpoint (e.g. sample minimum, $Q_1 - 1.5\cdot\text{IQR}$ fence, or p5). |
q1 |
float |
Required | First quartile (25th percentile, min <= q1). |
median |
float |
Required | Median value (50th percentile, q1 <= median). |
q3 |
float |
Required | Third quartile (75th percentile, median <= q3). |
max |
float |
Required | Upper whisker endpoint (e.g. sample maximum, $Q_3 + 1.5\cdot\text{IQR}$ fence, or p95; q3 <= max). |
mean |
float | None |
None |
Optional arithmetic mean value rendered when show_mean=True. |
outliers |
list[float] |
[] |
Outlier values beyond [min, max] rendered when show_box=True, show_outliers=True, and show_points=False. |
points |
list[float] |
[] |
Raw sample values rendered as strip/jitter markers when show_points=True (required if show_box=False). |
Methods#
from_values *(classmethod)*
@classmethod
def from_values(
    cls,
    values: Sequence[float],
    *,
    whisker_mode: WhiskerMode = "iqr",
    iqr_k: float = 1.5,
    whisker_percentiles: tuple[float, float] = (5.0, 95.0),
) -> BoxStats
Computes a BoxStats summary (min, q1, median, q3, max, arithmetic mean, outliers, and raw points) from a non-empty sequence of finite floats using inclusive linear percentile interpolation.
extent_values
def extent_values(
    self,
    *,
    show_box: bool,
    show_points: bool,
    show_outliers: bool,
    show_mean: bool,
) -> list[float]
Returns all numerical values from this slot that contribute to automatic value-axis domain scaling under the active visibility flags.
typeDrawDirection#
Spatial partial-rendering direction used with Series.draw_ratio (0.0 to 1.0) for progressive box and strip plot animations.
DrawDirection = Literal["bottom_to_top", "left_to_right"]
| Literal Value | Vertical BoxChart Behavior |
Horizontal BoxChart Behavior |
|---|---|---|
"bottom_to_top" |
All category boxes, whiskers, and markers expand outward from each slot's median (default). |
Category slots reveal sequentially from bottom to top, expanding outward from median. |
"left_to_right" |
Category slots reveal sequentially from left to right, expanding outward from median. |
All category boxes, whiskers, and markers expand outward from each slot's median (default). |
typeFormatterType#
Union type controlling numeric formatting for axis ticks (Axis.format) and inline median labels (BoxChart.value_format).
FormatterType = str | Callable[[float], str] | None
str: Standard Python format specification or template string (e.g."{:.1f}ms","${:,.0f}","{:.0f}%").Callable[[float], str]: Custom formatter function mapping a numericfloatvalue to a display string.None: Uses Drawlib's automatic compact number formatting (andAxis.format_value()fallback).
typeLegendPosition#
Literal type representing preset legend placement identifiers for chart layout helpers.
LegendPosition = Literal["top", "bottom", "right", "none", "auto"]
- Note:
BoxChartrenders legends at explicit canvas coordinates viaBoxChart.draw_legend()for full dashboard layout control.
typeOrientation#
Literal type specifying the primary distribution axis (BoxChart.orientation) or legend item flow (draw_legend).
Orientation = Literal["vertical", "horizontal"]
| Literal Value | Description |
|---|---|
"vertical" |
Distributions span vertically along y_axis across horizontal x_axis categories; legend items stack top-to-bottom. |
"horizontal" |
Distributions span horizontally along x_axis across vertical y_axis categories; legend items flow left-to-right. |
typePointShape#
Literal type specifying the geometric marker shape for strip sample points (point_shape), outliers (outlier_shape), and arithmetic means (mean_shape).
PointShape = Literal["circle", "square", "rhombus", "triangle", "none"]
| Literal Value | Description |
|---|---|
"circle" |
Circular point marker (default for point_shape and outlier_shape). |
"square" |
Axis-aligned square marker. |
"rhombus" |
Rotated diamond (45°) marker (default for mean_shape). |
"triangle" |
Upward-pointing equilateral triangle marker. |
"none" |
Suppresses marker geometry. |
typeScaleType#
Literal type controlling the numerical coordinate mapping algorithm on Axis (configure_x_axis / configure_y_axis).
ScaleType = Literal["linear", "log"]
| Literal Value | Description |
|---|---|
"linear" |
Standard arithmetic linear scaling with nice-number tick intervals ($1, 2, 5 \times 10^k$) (default). |
"log" |
Base-10 logarithmic ($\log_{10}$) scaling for skewed multi-order-of-magnitude distributions (requires positive values). |
classSeries#
Mutable data model representing a single registered distribution series in a BoxChart.
class Series:
    def __init__(
        self,
        name: str,
        stats: list[BoxStats | None],
        style: Style,
        legend_text_style: Style | None = None,
        *,
        show_box: bool = True,
        show_points: bool = False,
        show_outliers: bool = True,
        show_mean: bool = False,
        median_style: Style | None = None,
        whisker_style: Style | None = None,
        point_style: Style | None = None,
        outlier_style: Style | None = None,
        mean_style: Style | None = None,
        point_radius: float = 0.58,
        point_shape: PointShape = "circle",
        jitter: float = 0.45,
        show: bool = True,
        draw_ratio: float = 1.0,
        draw_direction: DrawDirection = "bottom_to_top",
    ) -> None: ...
Parameters & Attributes#
| Parameter / Attribute | Type | Default | Description |
|---|---|---|---|
name |
str |
Required | Series display name shown in draw_legend(). |
stats |
list[BoxStats | None] |
Required | Per-category BoxStats summaries aligned with BoxChart.categories (None for empty slots). |
style |
Style |
Required | Base Style defining box fill/border and automatic sub-element contrast colors. |
legend_text_style |
Style | None |
None |
Optional per-series text style override in draw_legend(). |
show_box |
bool |
True |
Whether to draw Q1–Q3 boxes, whiskers, and median lines for this series. |
show_points |
bool |
False |
Whether to draw strip/jitter sample markers for this series. |
show_outliers |
bool |
True |
Whether to draw outlier markers when show_box=True and show_points=False. |
show_mean |
bool |
False |
Whether to draw arithmetic mean markers for this series. |
median_style |
Style | None |
None |
Optional Style override for the median line. |
whisker_style |
Style | None |
None |
Optional Style override for whisker stems and T-caps. |
point_style |
Style | None |
None |
Optional Style override for strip/jitter sample markers. |
outlier_style |
Style | None |
None |
Optional Style override for outlier markers (also highlights tail points beyond [min, max] when show_points=True). |
mean_style |
Style | None |
None |
Optional Style override for the arithmetic mean marker. |
point_radius |
float |
0.58 |
Marker radius (> 0.0) for points, outliers, and mean markers in this series. |
point_shape |
PointShape |
"circle" |
Marker geometry for strip/jitter sample points in this series. |
jitter |
float |
0.45 |
Normalized transverse jitter spread ratio (0.0 to 1.0) for strip points. |
show |
bool |
True |
Toggles series visibility while preserving full-dataset axis domain bounds. |
draw_ratio |
float |
1.0 |
Partial rendering progress (0.0 to 1.0) for keyframe animations. |
draw_direction |
DrawDirection |
"bottom_to_top" |
Direction of partial spatial rendering ("bottom_to_top" or "left_to_right"). |
typeWhiskerMode#
Literal type selecting the statistical rule used by BoxChart and BoxStats.from_values() to compute lower/upper whisker endpoints (min, max) and outliers from raw sample values.
WhiskerMode = Literal["iqr", "min_max", "percentile"]
| Literal Value | Description |
|---|---|
"iqr" |
Standard Tukey fence rule: whiskers extend to the most extreme inlier samples within $[Q_1 - k\cdot\text{IQR},; Q_3 + k\cdot\text{IQR}]$ (k = iqr_k, default 1.5), classifying values beyond fences as outliers (default). |
"min_max" |
Full-range rule: whiskers span $[\min(\text{values}),; \max(\text{values})]$ with outliers = []. |
"percentile" |
Quantile rule: whiskers extend to inclusive (low_p, high_p) percentiles (whisker_percentiles, default (5.0, 95.0)), classifying tail samples outside [min, max] as outliers. |